2

In QGIS 2.6, I'm working with two point layers: center of the population per census tract and stores that accept food stamps. I'm using "distance to nearest hub" to calculate nearest food stamp outlet from the population center of each tract. I'm using miles as my measurement. However, looking at the output attribute table after running the analysis, distances appear to be very small- something like 0.00003. This obviously isn't right. Using the measure tool, I measured distances between two points in miles, then I went to google maps to measure the distance between the same two points, and the miles are close.

I thought it could be with my CRS, but everything lines up correctly, and I have CRS on the fly enabled. Specifically, I'm using WSG 84 (EPSG 4326) for all layers. Any ideas on this issue?

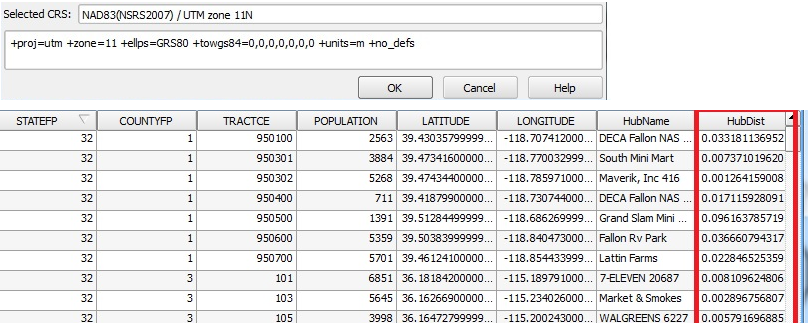
UPDATE: Pictures added based on responses below.CRS and Attribute table
5
  • 2
    try using a UTM crs and don't use miles. Save your layer as a new file and change the crs at that point, to the correct UTM zone for your part of the world. Sounds like you are working in degrees.
    – BillW
    Commented Jan 1, 2015 at 22:01
  • Do you still get the same results with the CRS on-the-fly disabled? Sometimes you can get errors if it is enabled even with the correct CRS although this bug is said to have been resolved.
    – Joseph
    Commented Jan 5, 2015 at 12:10
  • @Joseph I tried it just now with CRS on the fly disabled, and the result is the same from the picture above. Exact same numbers. Commented Jan 7, 2015 at 4:09
  • Distance Matrix - I have the same problem! I am working on a small area in Nairobi Kenya. I first worked with Geographic Coordinate System WGS84 and got very small values (e.g. 0.000109). I decided to close down QGIS and used ArcCatalog to project my data layers to UTM Arc1960 Zone 37S. Opened QGIS and used these UTM layers to calculate distance matrix between households and health clinics, but I got the same values which seem to have a factor of *100,000 to the real measured distance. How do I correct this? Besides posting your reply here for other users' benefit, kindly email it to me also a
    – user50328
    Commented Apr 10, 2015 at 12:51
  • @macharia I haven't fixed the issue. I still don't know the problem. Did you try with QGIS 2.8, the new version? I am now working with ArcGIS Desktop and Online. I hope I don't have that problem there. Commented Apr 20, 2015 at 1:02

1 Answer 1

1

As alluded to by @BillW, the distance you are getting is in the units of the CRS you are using. The units of EPSG 4326 are degrees. That is, the distance (0.00003) is in degrees.

If you want a distance in metres, use a CRS in metres (like UTM, or perhaps a state plane since it appears you're in the USA). Convert to miles later, if you have to.

7
  • I found out the Clark County, Nevada CRS is EPSG:3718 - NAD83(NSRS2007) / UTM zone 11N. I changed all layers and the project CRS to this. Then I deleted the output distance layer, and re-ran the analysis. I lost a few zeros now, but they're still under 1. See screen shots I added to original post. Commented Jan 2, 2015 at 1:22
  • Something is still wrong with your calculation. You need to go back and tell us what you've done (in detail) to allow us to figure out what.
    – BradHards
    Commented Jan 2, 2015 at 3:38
  • Let me start over with my pre-analysis layers, but without any output. CRS on the fly is enabled for the project. Study area is Clark County, Nevada in the USA. Here's all my layers right now, all using EPSG:3718 - NAD83(NSRS2007) / UTM zone 11N: Layer 1: Food stamp points. Layer 2: Population centroids per tract. Layer 3: Census Tracts. Layer 4: Counties. Now I will run the distance to nearest hub analysis. On the analysis screen: Source point layer: Population centroids. Destination hub layer: Food stamp outlets. Measurement unit: Meters. Continued on next comment... Commented Jan 2, 2015 at 4:33
  • After running analysis: Output lines appear correctly in the canvas with same CRS as other layers by default. Attribute table shows same "HubDist" column as in the picture, with decimals. Commented Jan 2, 2015 at 4:35
  • Please edit the question with those critical details. Consider that if I work out my answer isn't appropriate, I'll delete it, and your comments will go too. Note that if your coordinates aren't showing in UTM, they probably aren't.
    – BradHards
    Commented Jan 2, 2015 at 5:03

Your Answer

By clicking “Post Your Answer”, you agree to our terms of service and acknowledge you have read our privacy policy.

Not the answer you're looking for? Browse other questions tagged or ask your own question.