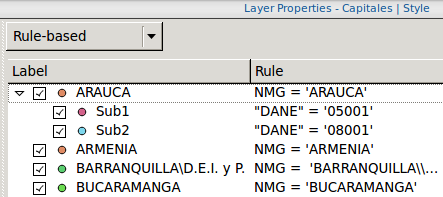
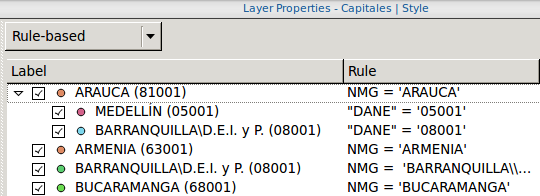
3

For features in a map it is possible to stuck data from the attribute table together and get a data driven label. I try to do this for my legend labels. I want to combine values from my attribute table to get a customised label. I want a legend with rule based label entries. Rather similar to "rule based style" but with combined column values.

enter image description here

For example: Klass_1 (3 %)

For instance Klass_1 is from a column "Klass" and 3 % from a column "Percentage".

Thats the plan:

enter image description here

How can I do this?

4
  • So you're using the Rule-based style and each rule is applied to a single feature, right? Commented Feb 25, 2015 at 14:59
  • Meanwhile, I did it manually for some features. They are grouped to (sub) groups. Major group by one feature category; subgroup by another feature category. For each category (column) I have percentages that I want to add to my label in the legend. I can't find a way to concatenate the attribute values (category, percentage) for my legend labels (groupwise).I added some images to clearify.
    – parallax
    Commented Feb 25, 2015 at 15:10
  • Right, but how many features are included into each subgroup? Only one? Commented Feb 25, 2015 at 15:23
  • As you can see above. One type (LC_Type) has up to 4 classes (KLASSE L2). Each class has one multipart feature. I can concatenate them within the attribute table and use the new column for labeling. But if the dataset is greater it would be easier to update it.
    – parallax
    Commented Feb 25, 2015 at 15:34

2 Answers 2

4

I've sort of replicated your situation.

enter image description here

Not sure if there's an easier way to do it, but the following code snippet works for me (I'm using QGIS v.2.8). To use it, activate your layer in the ToC, open the QGIS Python console, and copy&paste the code there.

lyr = iface.activeLayer()
renderer = lyr.rendererV2()
children = renderer.rootRule().children()
fieldName1 = "Klass"
fieldName2 = "Percentage"

for child in children: # Iterate through groups
    if child.filter():
        feat = next(lyr.getFeatures(QgsFeatureRequest(child.filter())), None)
        if feat:
            child.setLabel( feat.attribute(fieldName1) + " (" + feat.attribute(fieldName2) + ")")
        for subChild in child.children(): # Iterate through subgroups
            if subChild.filter():
                feat = next(lyr.getFeatures(QgsFeatureRequest(subChild.filter())), None)
                if feat:
                    subChild.setLabel( feat.attribute(fieldName1) + " (" + feat.attribute(fieldName2) + ")")

The code assumes fields to concatenate are of type String.

After the code runs, open the layer properties and you should see the new concatenated labels. Click on Ok to refresh your legend.

I obtain this:

enter image description here

Let me know if you have troubles with it.

3
  • I'm using v.2.6.1. It returns an SyntaxError File "<input>", line 11 lyr = iface.activeLayer() ^ SyntaxError: invalid syntax
    – parallax
    Commented Feb 25, 2015 at 16:12
  • Did you paste the code into the console that triggers after you click on Plugins->Python Console? Apart from that, did you select the layer in the ToC? Commented Feb 25, 2015 at 16:17
  • yes Plugins->Python Console
    – parallax
    Commented Feb 25, 2015 at 16:19
3

If this is a set of styles that you apply as part of a routine workflow, it might be worth setting up a QML style file that can be applied to any workspace of the same type.

If the styling of elements is thematic (and you know what columns drive the theme) you can build a QML file programmatically straight out of PostgreSQL (assuming you have your data in there... I put all our data into PostgreSQL using ogr2ogr, as a matter of routine).

For example, I have a file with ~150 styles for government zone polygons (subsets of the zones have the same style). We wanted to categorise by zone_code, but have a more-informative Legend entry - and we wanted to use a colour ramp as dictated by a specific table column:
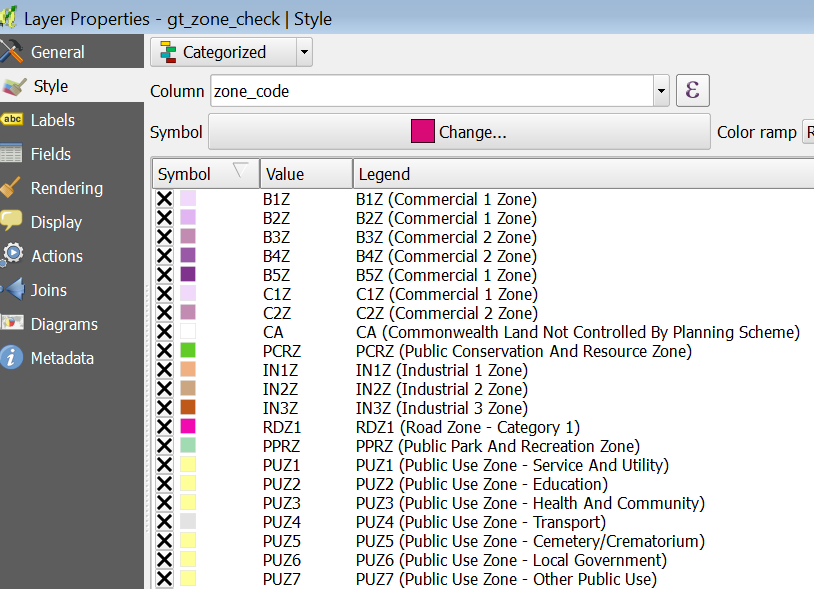
Zoning table

To create my QML file, I wrote a python script that looks like this -

import psycopg2

# Set up connection to database
conn_string = "host='localhost' dbname='[db]' user='[me]' password='[not telling]'"

# Connect to database
conn = psycopg2.connect(conn_string)

# set up default cursor (to run queries)
cursor = conn.cursor()


# Get LGA details; store them to a list
cursor.execute('select 
xmlelement(name qgis, 
xmlattributes(\'2.8.2-Wien\' as version), 
    xmlelement(name "renderer-v2", 
    xmlattributes(\'zone_code\' as attr, 0 as symbollevels, \'categorizedSymbol\' as type), 
    xmlelement(name symbols, 
              xmlagg(xmlelement(name symbol, 
                     xmlattributes(1 as alpha, \'fill\' as type, gid-1 as name), 
                     xmlelement(name layer, 
                     xmlattributes(0 as pass, \'SimpleFill\' as class, 0 as locked), 
                     xmlelement(name prop, 
                     xmlattributes(\'color\' as k, rgba as v)), 
                     xmlelement(name prop,
                     xmlattributes(\'outline_color\' as k, \'230,230,230,255\' as v)))))), 
                     xmlelement(name categories, 
                     xmlagg(xmlelement(name category,
                            xmlattributes(\'true\' as render, gid-1 as symbol, zone_code as value, zone_code||\' (\'|| description || \')\' as label)))))) 
from se_zones')
xml_new = ''
for row in cursor:
    print row[0]
    xml_new = row[0]

#print 'XML_New: ', xml_new # testing only

# pre-pend QGIS-specific DOCYTPE to XML
outStr= "<!DOCTYPE qgis PUBLIC 'http://mrcc.com/qgis.dtd' 'SYSTEM'>\n" + xml_new

# open destination XML file and save XML to it
outFile = open("Zones.qml", 'w')
outFile.write(outStr)

The script is kludgy (there's no need for the for row in cursor since cursor only returns one row), but result is exactly what I wanted: a QML file that I could distribute to my colleagues so that they could style Zoned data with 3 clicks.

Note that in this particular instance, zone_code and description are concatenated to give the Legend entry.

When theme files need to be built for different sets of categories, only the query has to change: we have ~25 different theme sets, and they were all constructed from that one script by changing the query and the destination file.

The output looks like this -

<!DOCTYPE qgis PUBLIC 'http://mrcc.com/qgis.dtd' 'SYSTEM' >
<qgis version="2.8.2-Wien">
  <renderer-v2 attr="zone_code" symbollevels="0" type="categorizedSymbol">
    <symbols>
      <symbol alpha="1" type="fill" name="0">
        <layer pass="0" class="SimpleFill" locked="0">
          <prop k="color" v="240,217,250,255" />
          <prop k="outline_color" v="230,230,230,255" />
        </layer>
      <symbol>
         ...
    </symbols>
    <categories>
        <category render="true" symbol="0" value="B1Z" label="B1Z (Commercial 1 Zone)" />
        ...
    </categories>
  </renderer-v2>
</qgis>

For your specific theme you would have to write the appropriate query (which means you need to know the columns that 'drive' the style categories).

Your Answer

By clicking “Post Your Answer”, you agree to our terms of service and acknowledge you have read our privacy policy.

Not the answer you're looking for? Browse other questions tagged or ask your own question.