10

I am trying to read a raster file in a .DEM format on windows using the 'raster' package in R.

I get problems with NA values, when loading the data into R in Windows 7, but I do not have the problem on a Mac with OSX Lion. On windows, the NA values do not seem to be read correctly. The question is why this happens?

The raster file used was downloaded from USGS with the following R code:

download.file('http://edcftp.cr.usgs.gov/pub/data/gtopo30/global/e020n90.tar.gz', 'e020n90.tar.gz')
untar('e020n90.tar.gz')

Then I read the raster into R using the 'raster' package. In OSX Lion and R64 version 2.13.1, the NA values are recognized:

> onMac <- raster('E020N90.DEM')
> onMac
class       : RasterLayer 
dimensions  : 6000, 4800, 28800000  (nrow, ncol, ncell)
resolution  : 0.008333333, 0.008333333  (x, y)
extent      : 20, 60, 40, 90  (xmin, xmax, ymin, ymax)
coord. ref. : +proj=longlat +ellps=WGS84 +towgs84=0,0,0,0,0,0,0 +no_defs 
values      : /Users/Tam/Desktop/E020N90.DEM 
min value   : -9999 
max value   : 5483 

> summary(values(onMac))
Min.  1st Qu.   Median     Mean  3rd Qu.     Max.     NA's 
-137       85      148      213      213     5483 13046160

But on Windows 7 (64Bit, same R version) it converts the cell values that should be NA's into numbers:

> onWindows <- raster('E020N90.DEM')
> onWindows
class       : RasterLayer 
dimensions  : 6000, 4800, 28800000  (nrow, ncol, ncell)
resolution  : 0.008333333, 0.008333333  (x, y)
extent      : 20, 60, 40, 90  (xmin, xmax, ymin, ymax)
coord. ref. : +proj=longlat +ellps=WGS84 +datum=WGS84 +no_defs +towgs84=0,0,0 
values      : E:/WorldDegreeDays/gsoddata/gtopo/E020N90.DEM 
min value   : -9999 
max value   : 5483 

> summary(values(onWindows))
Min. 1st Qu.  Median    Mean 3rd Qu.    Max. 
  1     150     946   27190   55540   65540

Why are there no NA values in the raster when I read it on Windows? How could I work around it? My guess is it has to do with the way numbers are stored, a lot of the NA values are converted to 55540.

Info from Windows (after loading raster):

SessionInfo()
R version 2.13.1 (2011-07-08)
Platform: x86_64-pc-mingw32/x64 (64-bit)

locale:
[1] LC_COLLATE=English_United States.1252 
[2] LC_CTYPE=English_United States.1252   
[3] LC_MONETARY=English_United States.1252
[4] LC_NUMERIC=C                          
[5] LC_TIME=English_United States.1252    

attached base packages:
[1] stats     graphics  grDevices utils     datasets  methods   base     

other attached packages:
[1] rgdal_0.7-1   raster_1.9-12 sp_0.9-88    

loaded via a namespace (and not attached):
[1] grid_2.13.1     lattice_0.19-30

Info from OSX (after loading raster):

R version 2.13.1 (2011-07-08)
Platform: x86_64-apple-darwin9.8.0/x86_64 (64-bit)

locale:
[1] en_US.UTF-8/en_US.UTF-8/C/C/en_US.UTF-8/en_US.UTF-8

attached base packages:
[1] stats     graphics  grDevices utils     datasets  methods  
[7] base     

other attached packages:
[1] rgdal_0.6-33  raster_1.9-12 sp_0.9-88    

loaded via a namespace (and not attached):
[1] grid_2.13.1     lattice_0.19-33
4
  • raster version 1.9-12 on both systems
    – yellowcap
    Commented Sep 21, 2011 at 12:21
  • Can you include your sessionInfo() in your post? Commented Sep 21, 2011 at 12:26
  • I got different values on raster_1.8-12 (but identical to yours on 1.9-12) on winXP. Commented Sep 21, 2011 at 12:35
  • Did it work fine with raster_1.8-12, or was it just different?
    – yellowcap
    Commented Sep 21, 2011 at 12:39

4 Answers 4

11
+200

One workaround is just to go for the raw data, since this is a very simple file format.

Not for everyone, but it can be illuminating to see what is happening.

## all these details are in the .HDR file
NROWS   <-      6000
NCOLS   <-      4800

At this point you can try the different options for integer sign and endianness directly, and reading this way we achieve what Robert does with the > 32767 transformation after the file is read.

x1 <- readBin("E020N90.DEM", "integer", size = 2, signed = TRUE, n = NROWS * NCOLS, endian = "big")

range(x1)
[1] -9999  5483

x1[x1 < -9998] <- NA

## now for the simple georeferencing, also in the HDR file

ULXMAP   <-     20.00416666666667
ULYMAP   <-     89.99583333333334
XDIM     <-     0.00833333333333
YDIM     <-     0.00833333333333

## now generate x/y coordinates, and the data matrix (flip on Y)
x <- list(x = seq(ULXMAP, by = XDIM, length = NCOLS),
       y = seq(ULYMAP - NROWS * YDIM, by = YDIM, length = NROWS),
      z = matrix(x1, nrow = NCOLS)[ , NROWS:1])

library(sp)

x <- image2Grid(x)

library(raster)
r <- raster(x)

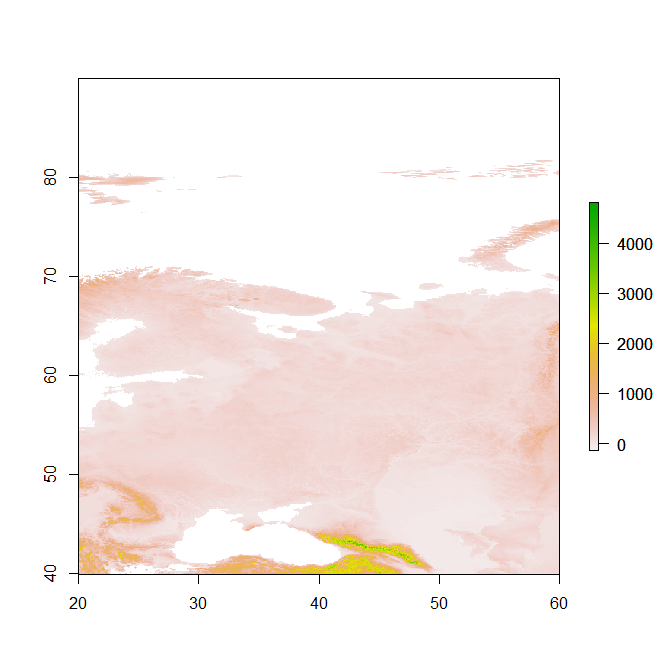
plot(r)

enter image description here

Finally, set the projection as it is read by raster (and this would give the same aspect ratio in the plot that is seen when read that way).

projection(r) <- "+proj=longlat +ellps=WGS84 +datum=WGS84 +no_defs +towgs84=0,0,0"

EDIT: Whoops, had forgotten to subtract from the top, now fixed - there's still a half-cell issue I haven't gotten to the bottom of as well.

2
  • In fact you can combine both methods (this answer and my/roberts answers): r <- raster('E020N90.DEM') and then run values(r)<-readBin("E020N90.DEM", "integer", size = 2, signed = TRUE, n = nrows(r) * ncols(r), endian = "big") and then values(r)[values(r)==-9999]<-NA
    – johanvdw
    Commented Sep 30, 2011 at 12:32
  • Ha yes but that is heresy
    – mdsumner
    Commented Oct 1, 2011 at 3:39
6

There are some issues with this file or with GDAL. I am using windows 7

R version 2.13.1 (2011-07-08)
Platform: x86_64-pc-mingw32/x64 (64-bit)

and

> getGDALVersionInfo()
[1] "GDAL 1.7.2, released 2010/04/23"


> GDALinfo('E020N90.DEM')
rows        6000 
columns     4800 
bands       1 
origin.x        20 
origin.y        40 
res.x       0.008333333 
res.y       0.008333333 
ysign       -1 
oblique.x   0 
oblique.y   0 
driver      EHdr 
projection  +proj=longlat +ellps=WGS84 +datum=WGS84 +no_defs 
file        E020N90.DEM 
apparent band summary:
 GDType  Bmin Bmax   Bmean    Bsd hasNoDataValue NoDataValue
1 UInt16 -9999 5483 -4412.9 5088.6           TRUE       -9999
> 

Note that the NoDataValue is the same as the Bmin value (-9999), which is odd. What is worse is that GDType is UInt16 -- Unsigned 2-byte Integers -- which means you cannot have values lower than zero. This is probably a bug that was fixed in gdal 1.8.0

The problem is illustrated when you do

r <- 'E020N90.DEM'
plot(r)

I think the fasted way to fix this is:

r <- raster('E020N90.DEM')
fun <- function(x){ x[x > 32767] <- x[x > 32767] - 65536; x[x == -9999] <- NA; x}
r[] <- fun(values(r))

plot(r)
r <- writeRaster(r, 'E020N90.TIF')
1
  • 1
    This fix is better than mine because the data points in the caspian sea are also converted (these points are also negative). Nice!
    – johanvdw
    Commented Sep 23, 2011 at 22:07
6

The issue seems to be caused by a problem recognising the fact that the data is in signed 2 byte integer format. It is wrongly interpreted as unsigned 2 byte integer format. Therefore your nodata value of -9999 becomes: 2bytes=256*256 -9999 = 55537

What I find strange is that min value : -9999 and max value : 5483 are the same for both windows and mac. It seems that in both cases no data was not correctly identified when building the headers, but when actually using it for the values an error occured.

workaround:

values(onWindows)[values(onWindows)>128*256]<-values(onWindows)[values(onWindows)>128*256]-256*256
values(onWindows)[values(onWindows)==-9999]<-NA

To dig deeper: It seems that raster calls rgdal, which in turn call gdal itself. Most likely you have a different version of gdal on your system. Check when loading rgdal eg:

Loaded GDAL runtime: GDAL 1.8.0, released 2011/01/12

I just did a quick check on linux: gdal 1.8 loads the file fine, but gdal 1.6 fails. So it does seem to be caused by gdal.

6
  • Loaded GDAL runtime: GDAL 1.7.2, released 2010/04/23 Commented Sep 21, 2011 at 13:26
  • On windows my GDAL version is also the one quoted above (1.7.2.), on OSX I do have 1.8.0. But why can't I read the DEM file using 1.7.2.? Is there any work-around?
    – yellowcap
    Commented Sep 21, 2011 at 13:52
  • I got different results in different versions of raster (see my comments above) so I'm not totally convinced it's GDAL per se. Commented Sep 21, 2011 at 14:15
  • Can you describe how rgdal can find an updated gdal installation on Win7? I downloaded and installed the most recent gdal binaries (both 32 and 64). These were installed to the default location but rgdal still uses 1.7.2, even after updating.
    – yellowcap
    Commented Sep 21, 2011 at 15:01
  • Updating rgdal is not obvious, and will require recompilation of rgdal. More info here.
    – johanvdw
    Commented Sep 21, 2011 at 15:08
0

Although I am not sure about your requirement, you can convert . DEM files into .GRID files. Then, the arcgis geoprocessor or R will automatically recognize .GRIDs with N/A values during grid raster manipulation.

2
  • Using another software to convert the file first is possible but not what I intended. The idea was to only use R for downloading, reading and analyzing the file.
    – yellowcap
    Commented Sep 24, 2011 at 13:49
  • in principle you could run gdaltranslate through R using system2.
    – johanvdw
    Commented Sep 28, 2011 at 13:51

Your Answer

By clicking “Post Your Answer”, you agree to our terms of service and acknowledge you have read our privacy policy.

Not the answer you're looking for? Browse other questions tagged or ask your own question.