4

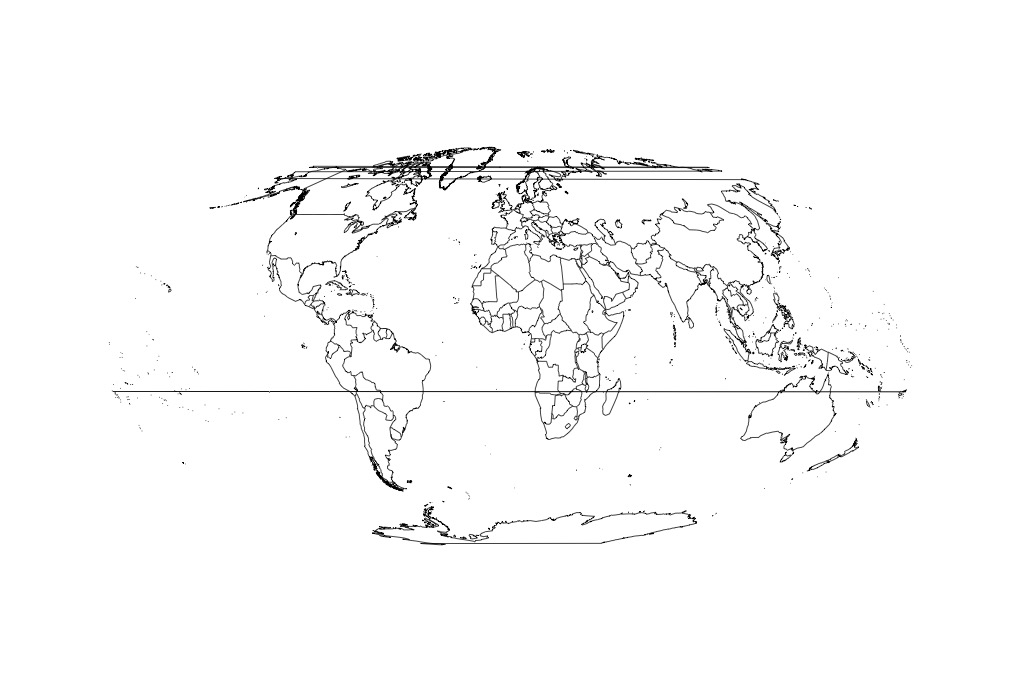
I'm having an odd problem such that when I reproject maps to a Mollweide projection in R using sp, I get additional lines stretching across the globe. What is going on here, and do you have any suggestions to fix it. Here's a reproductible example:

library(sp)
library(maps)
library(maptools)

worldmap <- map("world", plot=F)
plot(worldmap, type="l)

So far, so good. I get worldmap
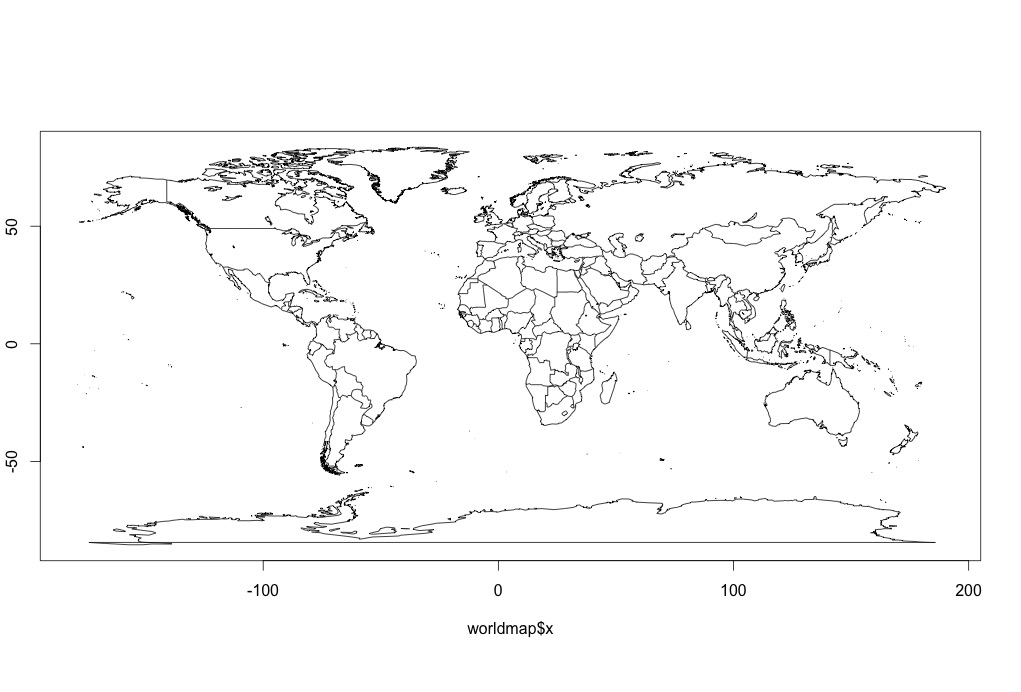
So now I reproject. This is a CRS I'm using to be compatible with some other projects. Note how world-spanning lines then crop up.

worldmapLines <- map2SpatialLines(worldmap,
                                  proj4string=CRS("+proj=longlat +datum=WGS84"))

worldM <- spTransform(worldmapLines,  
                      CRS("+proj=moll +lon_0=0 +x_0=0 +y_0=0 +ellps=WGS84 +units=m +no_defs"))

plot(worldM)
enter image description here

4 Answers 4

5

Your data exceeds the 180°E limit in eastern russia and some pacific island. If you want a good looking map in degrees, you have to cut your source data at 179.9°E/W.

See my answer here (though it deals with a pacific centered view)

QGIS display world country shape files centered on pacific ocean using Robinson, Miller Cylindrical or other projection

0
4

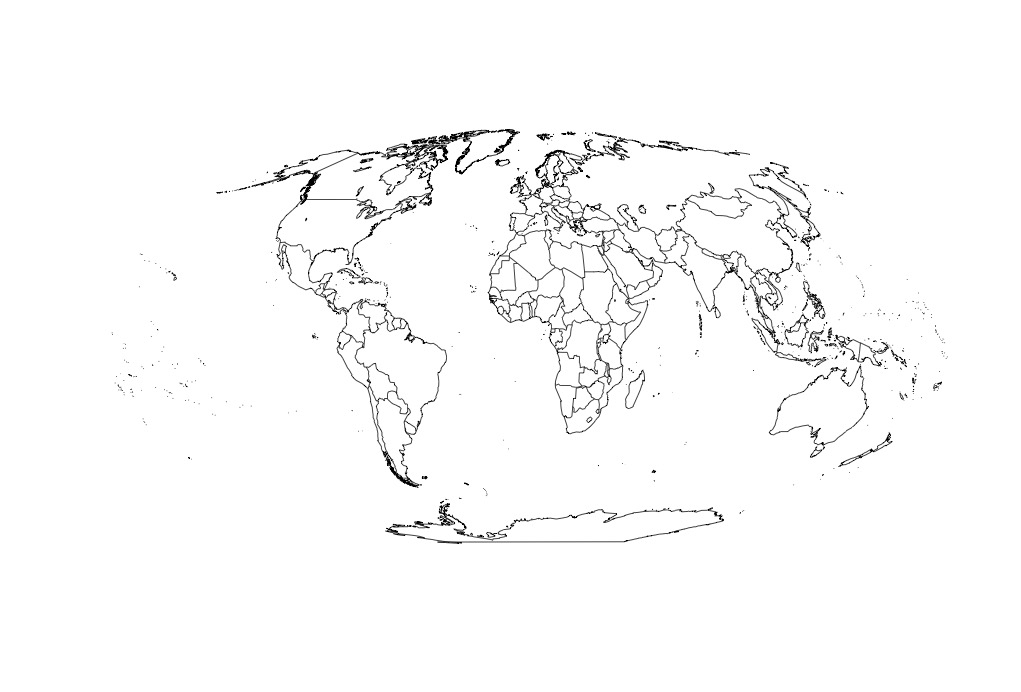
So, based on AndreJ's answer above, I whipped this up.

cleanSpLinesForProjection <- function(w){
  #We'll have to go through this one, line by line...
  slot(w, "lines") <- lapply(slot(worldmapLines, "lines"), function(x) {
    coords <- slot(x, "Lines")[[1]]@coords

    #get the rows with too large longitude values
    rIDX <- which(coords >= 180, arr.ind=T)[,1]

    #if there are some, replace them
    if(length(rIDX>0)) coords <- coords[-rIDX,]

    #replace the slot
    slot(x, "Lines")[[1]]@coords <- coords
    x
  })

  w
}

This works.

worldM <- spTransform(cleanSpLinesForProjection(worldmapLines),  
                      CRS("+proj=moll +lon_0=0 +x_0=0 +y_0=0 +ellps=WGS84 +units=m +no_defs"))

plot(worldM)

clean map

I just wish there were an argument for spTransform or a generic function for all sp objects. Ah well. I've learned something about sp here and whipped up some code I'm almost certain to use in the future. And now have to apply it to a SpatialPolygons object... What could possibly go wrong?

1
  • Did I read this code correctly--you are just removing vertices from the shapes? If so, you are losing information and risk distorting the shapes themselves. Perhaps the algorithm outlined at gis.stackexchange.com/posts/18986/edit would be more satisfactory as a general-purpose solution.
    – whuber
    Commented Jun 22, 2015 at 18:27
1

Your data are invalid:

> bbox(worldmapLines)
         min       max
x -179.95721 190.29080
y  -85.44308  83.57391

and the plot is correct, given that you provided it with wrong data.

With help from Roger Bivand: a corrected version of this dataset is available in maptools, try:

library(maptools)
data(wrld_simpl)
plot(spTransform(wrld_simpl, CRS=("+proj=moll +lon_0=0 +x_0=0 +y_0=0")))

Roger further mentioned: There is absolutely no easy way to break up geometries at "other side of the world" boundaries. wrld_simpl was partly based on recenter() but needed manual interventions (this was with GPCLib, before rgeos).

2
  • Great! Although it's not a unique problem. For example, I've been working with this shapefile - github.com/jebyrnes/meowR/blob/master/data/… - and have the same extra lines issue. This is data from marineregions.org/downloads.php. However, my function seems to aesthetically fix the issue.
    – jebyrnes
    Commented Jun 22, 2015 at 17:34
  • Oh and github.com/jebyrnes/meowR is just a little package as I keep using Marine Ecoregions for multiple projects, and wanted to stop re-writing the same code for each new project to load the same shapefiles....
    – jebyrnes
    Commented Jun 22, 2015 at 17:35
1

You can cut the area beyond 180 degrees and shift to its usual representation (there is nothing really wrong with having degrees beyond 180, but it is not expected by most software).

What you have

library(sp)
library(maps)
library(maptools)
worldmap <- map("world", plot=F)
worldmapLines <- map2SpatialLines(worldmap, proj4string=CRS("+proj=longlat +datum=WGS84"))

Now you can do:

library(raster)
w1 <- crop( worldmapLines, extent(-180, 180,-90,90))
w2 <- crop( worldmapLines, extent(180, 200,-90,90))
w2 <- shift(w2, -360)
w <- bind(w1, w2)
x <- spTransform(w, CRS("+proj=moll +lon_0=0 +x_0=0 +y_0=0 +ellps=WGS84 +units=m +no_defs"))
plot(x)

Your Answer

By clicking “Post Your Answer”, you agree to our terms of service and acknowledge you have read our privacy policy.

Not the answer you're looking for? Browse other questions tagged or ask your own question.