I am using the cshapes package in R as a source of historically accurate country borders. While the default WGS 84 maps plot fine, I would like to reproject the maps. This introduces some distortions that I'm guessing are related to underlying issues in the map data:
- How can I correctly reproject and plot a
cshapesmap in R? - If the distortion issue really is related to underlying map data issue, how can I fix these?
Here is a default WGS 84 map, which looks fine:
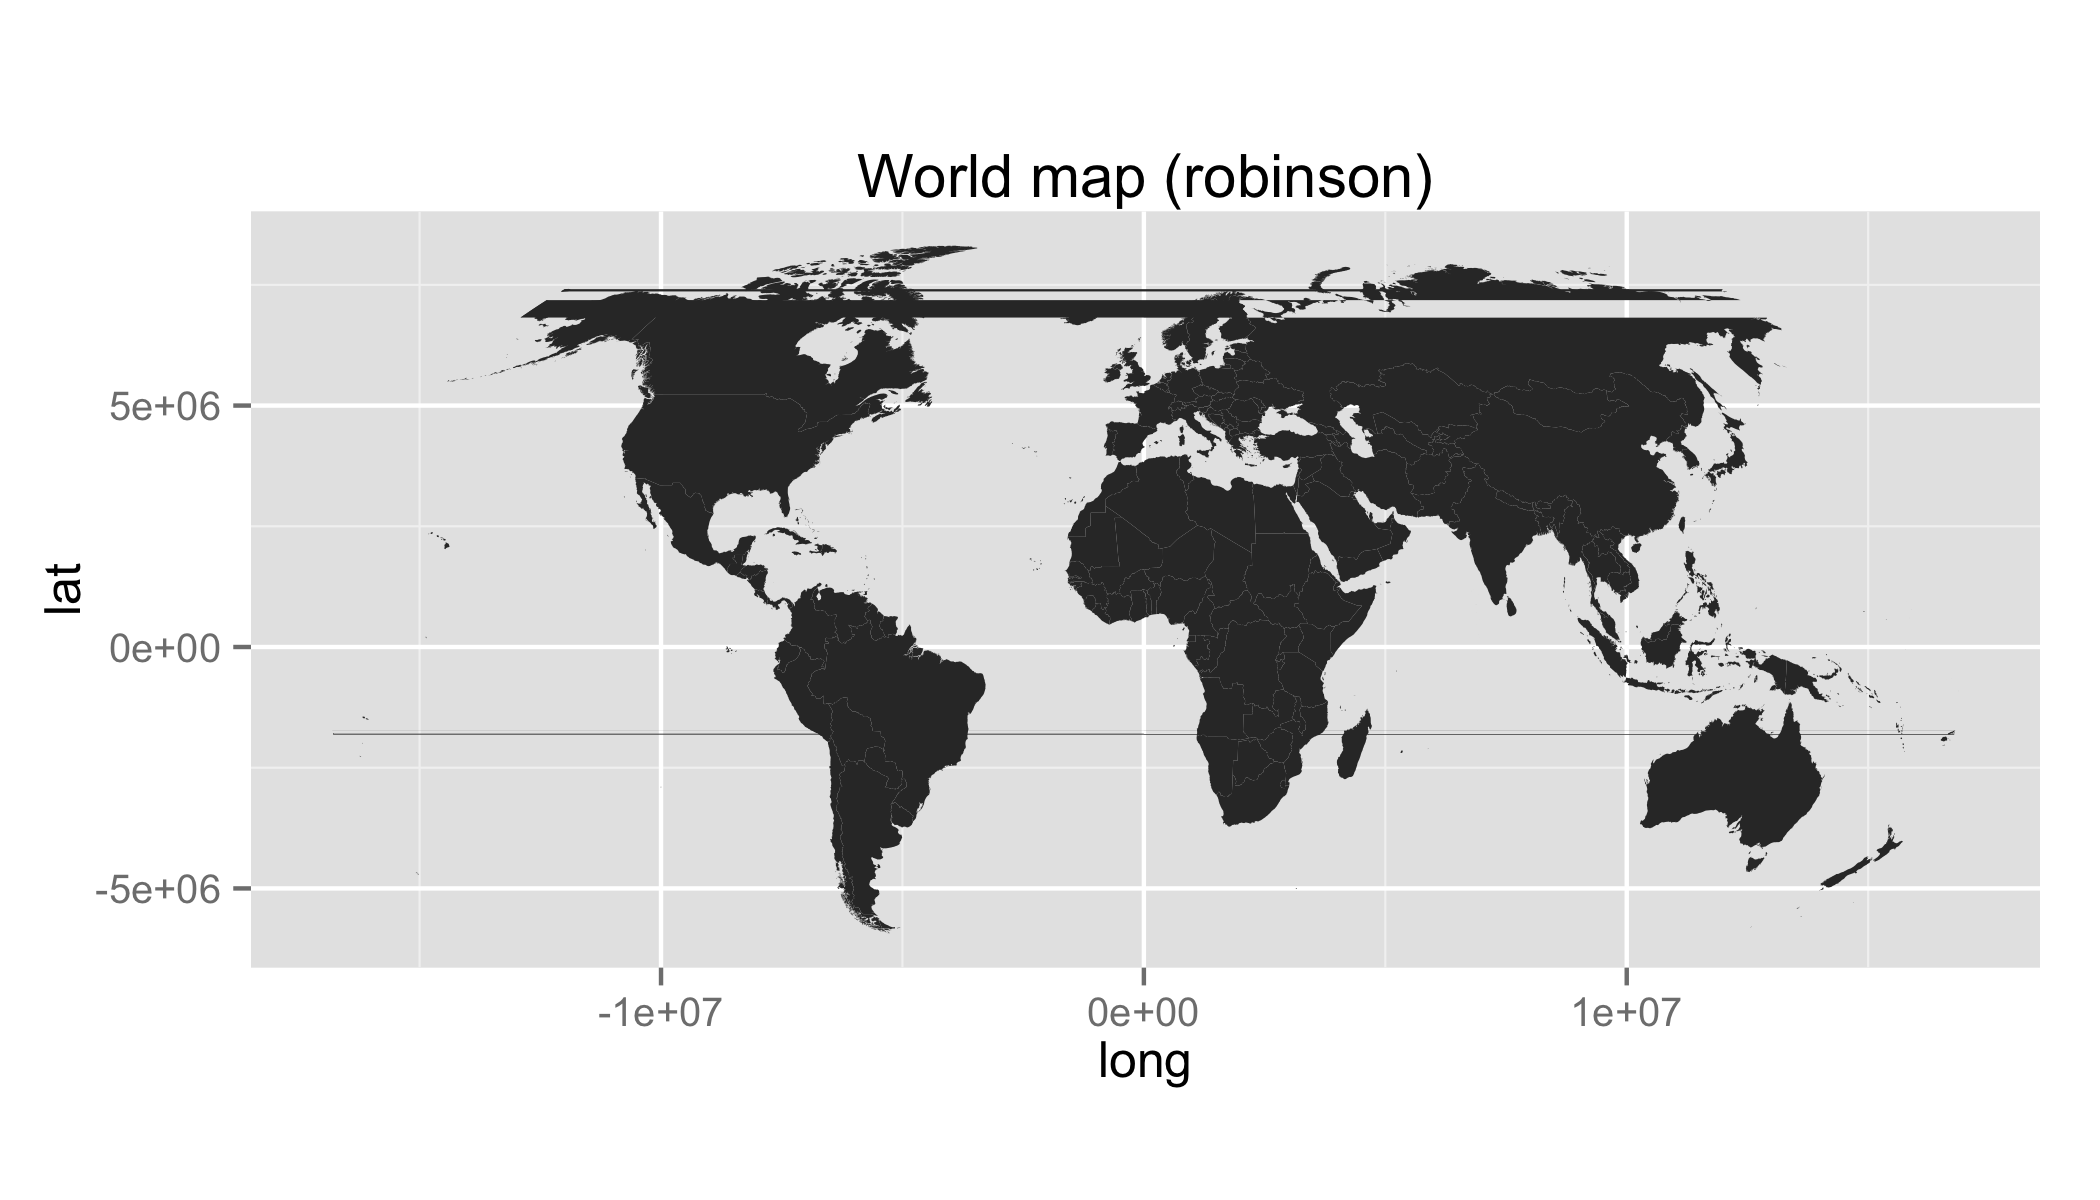
But when attempting to plot a Robinson projected map, distortion near 180 longitude:
The associated shapefile is here.
I created these maps in R using the following code:
library("cshapes")
library("ggplot2")
library("rgdal")

# Get map data and plot with default CRS (WGS 84)
wmap <- cshp(date=as.Date("2012-06-30"))
wmap_df <- fortify(wmap)

ggplot(wmap_df, aes(long,lat, group=group)) +
  geom_polygon() +
  labs(title="World map (longlat)") +
  coord_equal()

ggsave("~/Desktop/map1.png", height=4, width=7)

# Reproject to Robinson
wmap_robin <- spTransform(wmap, CRS("+proj=robin"))
wmap_df_robin <- fortify(wmap_robin)
ggplot(wmap_df_robin, aes(long,lat, group=group)) +
  geom_polygon() +
  labs(title="World map (robinson)") +
  coord_equal()

ggsave("~/Desktop/map2.png", height=4, width=7)

# Export original map data
writeOGR(wmap, ".", "wmap_wgs84", driver="ESRI Shapefile")
Additional info:
- Duplicate of original question on SO, someone over there suggested I try to get help here.
- I know there are many other sources for country borders, but I'm tied to
cshapesfor historically accurate maps. - I'm using GDAL 1.11.3, installed via homebrew, and Proj4 4.9.2. I built
rgdalfrom source against these. - Part of my problem is that I don't know what terms to even search for for this issue, any help would be great.
There is a similar question here, which indicates that the problem is that Russia and a Pacific island exceed 180°E. However, the answers provided are either implemented in QGIS, not R, or are based on removing vertices, which is problematic for me because I want to eventually use the maps to make thematic maps (i.e. countries with color fill).


