0

I have a Flex Viewer that allows users to undertake a GP raster processing task by selecting a series of datasets (rasters with predefined scientific scores) through the GUI and then asks the user to assign an inputted 'weight' (1-3) score for each variable before the analysis is undertaken.

The 'weights' are already captured as parameters in my model and used in the raster calculation process ("%Dataset1%" * float(%Theme1 Weight%)).

I have the mapped output displaying in the print window and would like to also show the 'weights' that were inputted by the user (Theme1 Weight).

Any suggestions on how this could be done?

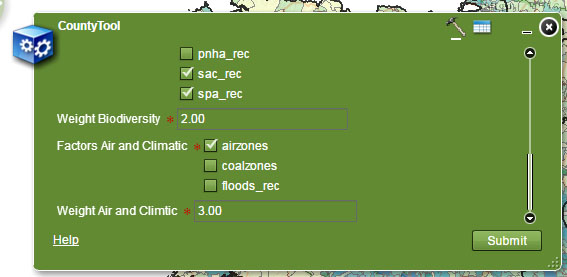
The image below is the GP input window for users. What I want to do is display the Weight scores input by the user (2 for Biodiversity and 1 for Air etc) in the print window. enter image description here
2
  • Can you elaborate on what you're trying to accomplish? Perhaps with a screenshot with notes explaining what you're trying to do?
    – Eok
    Commented Jun 29, 2015 at 19:57
  • Hi Eok N, I've added an image to the original post. Thanks for your reply. I have the print window set up by am looking for a way of adding the user input scores from the GP window to the final print window. That way the user will have a map with details on the scores that they used. Thanks
    – Justin
    Commented Jun 29, 2015 at 20:16

1 Answer 1

1

Assuming your Flex Viewer app is generated from the Application Builder and the "print window" is just the default print widget, it sounds like you just want to customize print widget with a few new labels. I believe the only way to achieve that is to go and edit the source code for the print widget and recompile it.

The source code can be found here: http://github.com/Esri/arcgis-viewer-flex/tree/develop/src/widgets

Your Answer

By clicking “Post Your Answer”, you agree to our terms of service and acknowledge you have read our privacy policy.

Not the answer you're looking for? Browse other questions tagged or ask your own question.