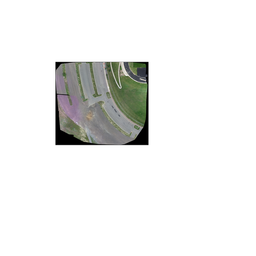
I have a tiff that was created with Pix4dmapper. This tiff has coordinates embedded (as seen in the logs below) (I think that makes it a geotiff?) as well as a tfw file associated with it.
Opening the tiff in an image viewing (Windows photo viewer) or editing tool (Paint.NET) shows that the region outside of my imagery is transparent.
Creating tiles with gdal2tiles creates pngs that have black where there is transparency in the source tiff.
Edit: Changing the resample type doesn't help.
How do I fix this? (Logging and sample output below)
> gdal2tiles --version
GDAL 1.11.2, released 2015/02/10

> gdalinfo stadium3857.tif
Driver: GTiff/GeoTIFF
Files: stadium3857.tif
Size is 11938, 10667
Coordinate System is:
PROJCS["WGS 84 / Pseudo-Mercator",
    GEOGCS["WGS 84",
        DATUM["WGS_1984",
            SPHEROID["WGS 84",6378137,298.257223563,
                AUTHORITY["EPSG","7030"]],
            AUTHORITY["EPSG","6326"]],
        PRIMEM["Greenwich",0],
        UNIT["degree",0.0174532925199433],
        AUTHORITY["EPSG","4326"]],
    PROJECTION["Mercator_1SP"],
    PARAMETER["central_meridian",0],
    PARAMETER["scale_factor",1],
    PARAMETER["false_easting",0],
    PARAMETER["false_northing",0],
    UNIT["metre",1,
        AUTHORITY["EPSG","9001"]],
    EXTENSION["PROJ4","+proj=merc +a=6378137 +b=6378137 +lat_ts=0.0 +lon_0=0.0 +x_0=0.0 +y_0=0 +k=1.0 +units=m +nadgrids=@null +wktext  +no_defs"],
    AUTHORITY["EPSG","3857"]]
Origin = (-11713078.632369816000000,4839234.097803738000000)
Pixel Size = (0.018605312329563,-0.018605312329563)
Metadata:
  AREA_OR_POINT=Area
  TIFFTAG_SOFTWARE=pix4dmapper
Image Structure Metadata:
  INTERLEAVE=PIXEL
Corner Coordinates:
Upper Left  (-11713078.632, 4839234.098) (105d13'13.35"W, 39d48'57.46"N)
Lower Left  (-11713078.632, 4839035.635) (105d13'13.35"W, 39d48'52.53"N)
Upper Right (-11712856.522, 4839234.098) (105d13' 6.17"W, 39d48'57.46"N)
Lower Right (-11712856.522, 4839035.635) (105d13' 6.17"W, 39d48'52.53"N)
Center      (-11712967.577, 4839134.866) (105d13' 9.76"W, 39d48'54.99"N)
Band 1 Block=11938x1 Type=Byte, ColorInterp=Red
  NoData Value=-10000
Band 2 Block=11938x1 Type=Byte, ColorInterp=Green
  NoData Value=-10000
Band 3 Block=11938x1 Type=Byte, ColorInterp=Blue
  NoData Value=-10000
Band 4 Block=11938x1 Type=Byte, ColorInterp=Alpha
  NoData Value=-10000

> gdal2tiles -p mercator -r lanczos -z 16 stadium3857.tif 3857tiles
Generating Base Tiles:
0...10...20...30...40...50...60...70...80...90...100 - done.
Generating Overview Tiles:
0...10...20...30...40...50...60...70...80...90...100 - done.


> gdalinfo -stats stadium3857.tif
Driver: GTiff/GeoTIFF
Files: stadium3857.tif
Size is 11938, 10667
Coordinate System is:
PROJCS["WGS 84 / Pseudo-Mercator",
    GEOGCS["WGS 84",
        DATUM["WGS_1984",
            SPHEROID["WGS 84",6378137,298.257223563,
                AUTHORITY["EPSG","7030"]],
            AUTHORITY["EPSG","6326"]],
        PRIMEM["Greenwich",0],
        UNIT["degree",0.0174532925199433],
        AUTHORITY["EPSG","4326"]],
    PROJECTION["Mercator_1SP"],
    PARAMETER["central_meridian",0],
    PARAMETER["scale_factor",1],
    PARAMETER["false_easting",0],
    PARAMETER["false_northing",0],
    UNIT["metre",1,
        AUTHORITY["EPSG","9001"]],
    EXTENSION["PROJ4","+proj=merc +a=6378137 +b=6378137 +lat_ts=0.0 +lon_0=0.0 +x_0=0.0 +y_0=0 +k=1.0 +units=m +nadgrids=@null +wktext  +no_defs"],
    AUTHORITY["EPSG","3857"]]
Origin = (-11713078.632369816000000,4839234.097803738000000)
Pixel Size = (0.018605312329563,-0.018605312329563)
Metadata:
  AREA_OR_POINT=Area
  TIFFTAG_SOFTWARE=pix4dmapper
Image Structure Metadata:
  INTERLEAVE=PIXEL
Corner Coordinates:
Upper Left  (-11713078.632, 4839234.098) (105d13'13.35"W, 39d48'57.46"N)
Lower Left  (-11713078.632, 4839035.635) (105d13'13.35"W, 39d48'52.53"N)
Upper Right (-11712856.522, 4839234.098) (105d13' 6.17"W, 39d48'57.46"N)
Lower Right (-11712856.522, 4839035.635) (105d13' 6.17"W, 39d48'52.53"N)
Center      (-11712967.577, 4839134.866) (105d13' 9.76"W, 39d48'54.99"N)
Band 1 Block=11938x1 Type=Byte, ColorInterp=Red
  Minimum=0.000, Maximum=255.000, Mean=110.742, StdDev=52.510
  NoData Value=-10000
  Metadata:
    STATISTICS_MAXIMUM=255
    STATISTICS_MEAN=110.74218332168
    STATISTICS_MINIMUM=0
    STATISTICS_STDDEV=52.509895067021
Band 2 Block=11938x1 Type=Byte, ColorInterp=Green
  Minimum=0.000, Maximum=255.000, Mean=114.435, StdDev=49.943
  NoData Value=-10000
  Metadata:
    STATISTICS_MAXIMUM=255
    STATISTICS_MEAN=114.43497066961
    STATISTICS_MINIMUM=0
    STATISTICS_STDDEV=49.943341035251
Band 3 Block=11938x1 Type=Byte, ColorInterp=Blue
  Minimum=0.000, Maximum=255.000, Mean=104.162, StdDev=53.886
  NoData Value=-10000
  Metadata:
    STATISTICS_MAXIMUM=255
    STATISTICS_MEAN=104.16159443554
    STATISTICS_MINIMUM=0
    STATISTICS_STDDEV=53.885963342186
Band 4 Block=11938x1 Type=Byte, ColorInterp=Alpha
  Minimum=0.000, Maximum=255.000, Mean=225.883, StdDev=81.100
  NoData Value=-10000
  Metadata:
    STATISTICS_MAXIMUM=255
    STATISTICS_MEAN=225.8825106791
    STATISTICS_MINIMUM=0
    STATISTICS_STDDEV=81.099516598291
Sample output at 16 zoom


gdalinfo -stats stadium3857.tif)? – could it be that your alpha channel band is also masked by NoData values? Also: how does the tiff display in a GIS?Band 1 Block=16000x1 Type=Byte, ColorInterp=Red Mask Flags: PER_DATASET ALPHA Band 2 Block=16000x1 Type=Byte, ColorInterp=Green Mask Flags: PER_DATASET ALPHA Band 3 Block=16000x1 Type=Byte, ColorInterp=Blue Mask Flags: PER_DATASET ALPHA Band 4 Block=16000x1 Type=Byte, ColorInterp=Alphagdal_translate -b 1,2,3 stadium3857.tit stadium3857_RGB.tif(selects only bands 1-3, discarding band 4) and re-generating it usinggdalwarp -dstalpha stadium3857_RGB.tif stadium3857_RGBA.tif