5

Are there any methods and/or technical guides on how to classify the degree of winding of river bodies?

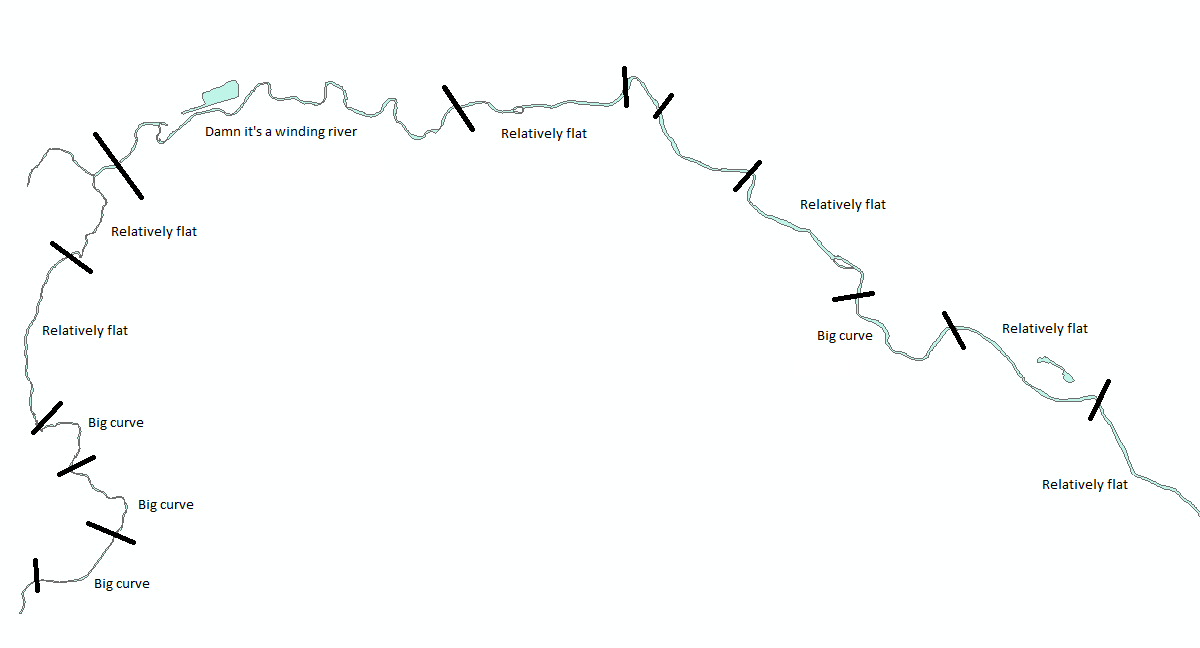
I have the following polygon layer of roughly 100,000 water bodies and would like to write an automated process. I want to divide them into sections based on how flat or curvy they are as shown in the image below.

For now, I'm focusing on x and y dimensions. Eventually, I will look into elevation differentials.

enter image description here

3 Answers 3

6

In the world of hydrology and geomorphology, there is indeed a metric that we use to classify/quantify the "curviness" of a river......sinuosity.

Sinuosity is simply a measure of the actual path length of the river divided by the shortest path length (straight line distance).

So, you could measure the sinuosity of the river as a whole (actual path length of entire river divided by straight line distance from head to mouth), or, for what you're doing, you will want to subdivide the river into individual reaches (the length of which you will have to decide.....but should be approached cautiously because different lengths could drastically affect the sinuosity measurement) and divide the actual path length of the individual reach by the straight line distance from the top to the bottom of that individual reach.

Does that make sense? This is a very common measure in hydrology/geomorphology and should be fairly simple to automate. I'm no programmer, but a few years ago I did a simple automation of this process using ModelBuilder in ArcGIS. So I imagine you programmers out there could make something even less clunky.

1
  • Nice. So as a programmer with an interest in data science, my next question becomes, "How can we automate the identification of and extraction of such reach segments, as you described them?" :)
    – elrobis
    Commented Aug 19, 2015 at 19:12
2

I'm not a hydrologist, so I'm not aware of any metrics/heuristics that should likely govern your methods, but here's a stream-of-consciousness response for something that would be fun to try.

Interpolate points along the line:

First, I'd interpolate points along the line with an equal-length, short spacing according to a minimal granularity where the distance between points arguably equates with a distance long-enough to establish a "winding trait".

I'd experiment with something like 4x the bank-full width, or maybe the width of the 25 or 50 yr floodplain as the spacing distance. In other words, something other than a magic-number guess that could be repeated for other streams---as such an approach would make it repeatable for streams in subsequent studies.

Get change-in-bearing values for each point:

Next, I'd iterate over the points (or do this alongside the interpolation, above) and get a value for the change in bearing between each point and the two points preceding/following it. Obviously, the higher the delta value, the more winding.

Pick thresholds to classify winding intensity:

Once you had the delta values established, you could probably "eyeball" that data against your flow path and select a thresholds for value ranges that constitute various intensities of winding. Alternatively, you could use most any classification criteria as you might for a typical choropleth map.

What a fun research question to explore. I'm jealous. :)

PS. FWIW, I'd do 100% of this in PostGRESql using PostGIS spatial queries/operators. Useful functions would include.. ST_Line_Interpolate_Point, ST_Azimuth, and possibly generate_series

3
  • 1
    I believe this suggestion may be the same procedure discussed at gis.stackexchange.com/questions/37058 --or at least could be implemented in the same way. It would be most interesting to know what measure of "delta values" would have hydrological meaning.
    – whuber
    Commented Aug 19, 2015 at 16:02
  • @whuber that ^ is definitely a smarter/better answer to a related question. The only difference I think I'm detecting is the approach I proposed doesn't assume any pre-established line segments, and instead creates its own segments at equal intervals---where the shorter the better, and where the interval distance corresponds to some truly measurable stream feature, for which I thought a magnification of bankfull width might provide a nice common trait to derive against.
    – elrobis
    Commented Aug 19, 2015 at 16:13
  • Unfortunately, I don't think there are any GISes extant that don't represent a river in terms of such line segments. Either it is a polyline--which is a sequence of such segments, or a polygon (bounded by such a sequence), or it is in a raster format, in which case it's given by a set of grid (center) points that can be analyzed in the same way. Your sequence of points of "minimal granularity" will be derived by interpolating the underlying data. I believe--but would need to consult the literature--that river energy is of interest and that's directly related to curvature (and gradient).
    – whuber
    Commented Aug 19, 2015 at 16:19
0

I've got a sinuosity and gradient toolbox that you may end up wanting to take a look at - http://www.arcgis.com/home/item.html?id=c8eb4ce1384e45258ccba1b33cd4e3cb

Your Answer

By clicking “Post Your Answer”, you agree to our terms of service and acknowledge you have read our privacy policy.

Not the answer you're looking for? Browse other questions tagged or ask your own question.