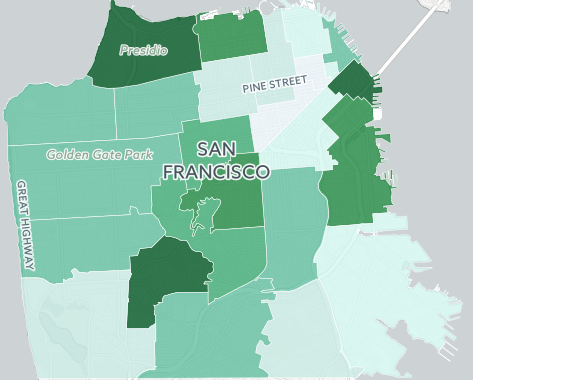
I have a map of zipcodes in San Francisco that I plotted on CartoDB.The CartoDB view looks about like I expected:
But when I had CartoDB generate an SVG, the proportions are way off.
I took the same data to QGis and got the exact same distortion when I output an SVG. What on earth is going on here and how do I fix it?

