1

I have a point layer of known landslide locations, and a raster layer (30m) of vegetation cover (categorical). My goal is to extract the prevailing raster value around the point locations.

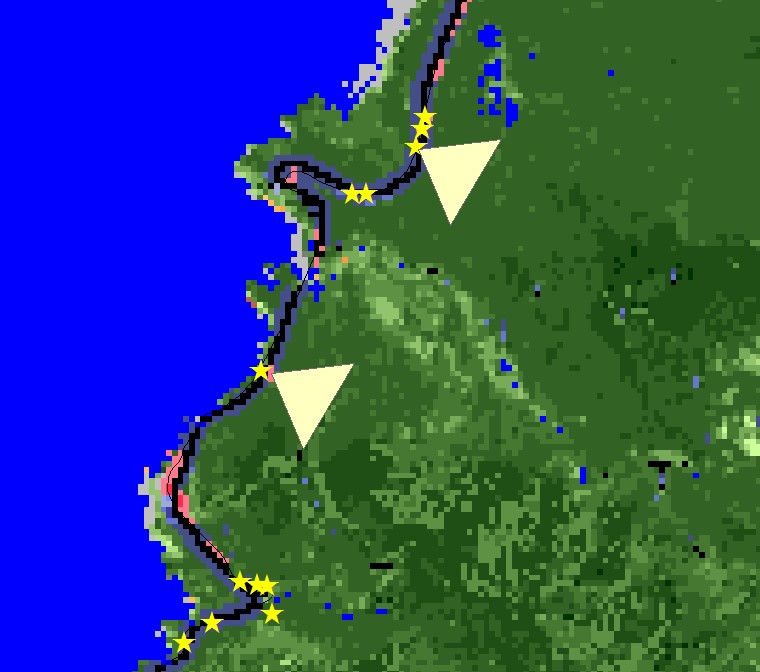
Almost all landslides are located within 30m of a road which means that if I use the "extract value to point' tool, my out put would only correspond to the raster class "Developed-Roads". This is not helpful since I need to look at cells further away from the road in order to obtain "true" vegetation values like "Tree Cover >= 70 and < 80%", for instance. I can't create buffers around the point locations and run zonal statistics, because there is too much overlap.

When I researched this problem, I also came across the "focal statistics" tool, but I don't see how that is helpful. Even though the tool allows you to define various neighborhoods that would certainly be an advantage, it doesn't allow me to input a point feature and a raster layer at the same time.

Can I use focal statistics, if so how? If not, what other options are there?

Check out the picture to get a better idea of the problem:

enter image description here

3
  • It's re-opened, but be sure to complete the Tour too.
    – PolyGeo
    Commented Feb 21, 2016 at 23:00
  • 1
    Focal calculations give the most efficient, direct answer to your question: after computing the focal grid for the Tree Cover indicator, all you have to do is read off the answer at any point.
    – whuber
    Commented Feb 22, 2016 at 17:47
  • I have a similar question but do not see the answer posted in this thread. I would like to count the number of raster cells within a certain radius of a point feature class and assign that count to a field in the point feature class. There are many points that will have overlapping neighborhoods as in the example listed in the original question. Any ideas? Thanks.
    – Matt L.
    Commented Dec 2, 2016 at 20:43

2 Answers 2

0

How about this: Have you tried shifting your points away from the line (which I guess is the centre of the road) by a certain distance and then running the extract value to point tool?

Therefore I'd probably shift the line, then snap the points to it in order to get them off the road.


As for the focal statistics tool, you could try using it with the "MAJORITY" statistics type and a big enough neighbourhood in order to completely get rid of the road. The tool looks at the defined neighbourhood of each cell in the raster and then calculates the desired statistics type. However, this will give you an average over the whole area (that is your defined neighbourhood) and not just the spatially closest cells to your points... For more information on the tool, check the following Focal Statistics Tool Help.

Let me know if this is pointing in the right direction.


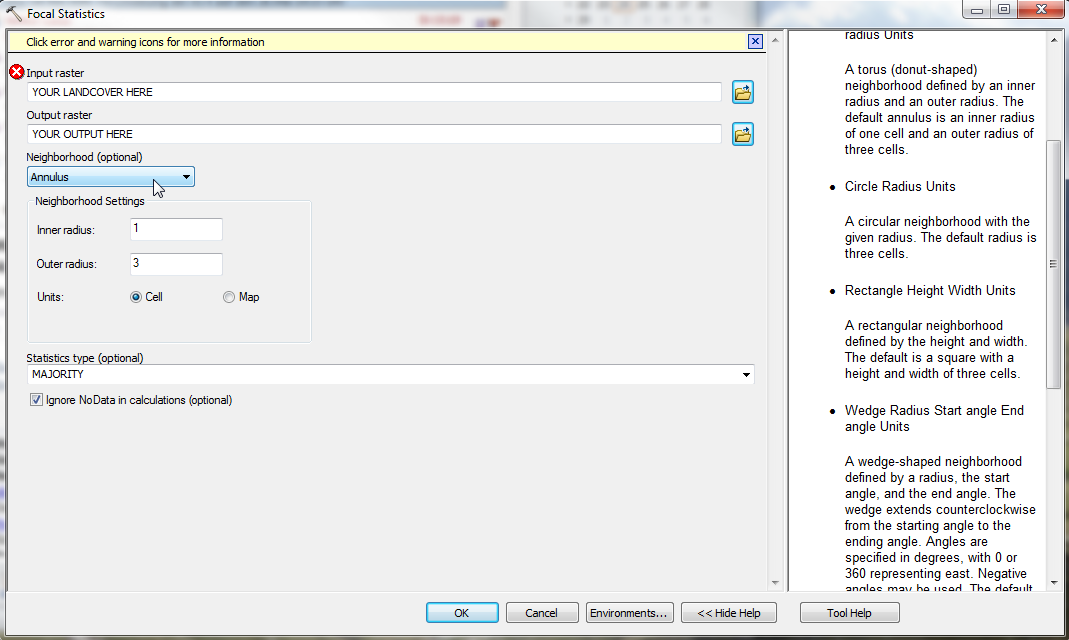
Edit 24th of February: Here's an example of how I'd run the focal statistics tool:

focalstatistics Note that you won't be able to run the tool for two rasters. If you want to reduce your output raster size, you might want to extract the surroundings of all points (i.e. using the buffer tool) and clip (data management) the raster to a smaller extent. In order not to get any ocean land cover as a result, you might be better off to reclassify your land cover raster first (set the ocean values to "No Data").

For your problem I'd try the "Annulus" search radius. This way you might be able to exclude some road cells from your result. Set the inner radius to one or two cells (these won't be used for calculations) and the outer radius to a wide enough radius. Everything inbetween will be used to find the majority cells.

2
  • Moving the points won't work since there are several thousand of them unless you know of a way to automate this. I have considered using focal statistics with majority. How do I use this tool correctly. I have looked at the help file many times, but I don't see how I can define a neighborhood around my points and then extract the landcover. Even if I converted by points to raster, I don't think the tool allows you to process two raster layers. Maybe I am missing something?
    – DanM
    Commented Feb 23, 2016 at 15:55
  • Ok, so the first suggestion probably isn't the best when you work with several thousand points. With focal statistics you cannot work with only the surroundings of your points. It will create a new raster, that displays the most occurring raster value in the defined neighbourhood for each cell for the whole raster. I have added an image to my answer to clarify the use of the tool.
    – dru87
    Commented Feb 24, 2016 at 6:46
0

I have a couple of ideas. In all cases, you will need to convert your point layer to a raster. In the first case below, you would convert the points to a raster, and in the second case, you would convert your triangles to a raster, identifying them as separate unique zones. Since you have overlapping areas, you may need to iterate your analysis.

  1. If the triangle shape is not required, you could shift the points to the middle of the triangle and use the Spatial Analayst > Generalization Toolset > Majority Filter tool.
  2. You could also convert the triangles to unique zones on a raster and use the Spatial Analyst > Zonal Toolset > Zonal Histogram tool. Since you have overlapping areas, you may need to iterate your analysis.

Your Answer

By clicking “Post Your Answer”, you agree to our terms of service and acknowledge you have read our privacy policy.

Not the answer you're looking for? Browse other questions tagged or ask your own question.