0

I've included an image of a project I'm working on. There are two layers representing sub-surface geologic formations, and these were generated using elevation borehole data (so, point data), to interpolate each surface using Spline with Barriers. They will eventually be apart of a groundwater model.

The circled orange spots are problem areas where the interpolation appears to be incorrect. Is there a way to manually change these values myself so we can insert, say, an average instead? (We are fairly certain these two layers do not "swap positions" in these spots.)

I haven't found much in the way of manually manipulating floating-point rasters after having generated them through interpolation, but I'm guessing there's something in the ArcToolbox that I'm just missing. I'm rather new to ArcMap.

I'm using ArcMap 10.3 Desktop with 3D Analyst and Spatial Analyst licenses.
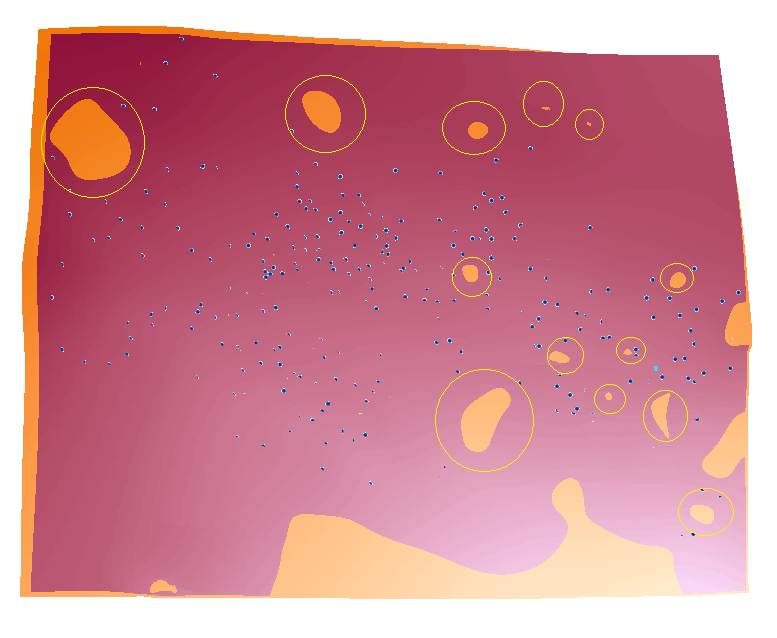
Spline with Barriers: two surfaces overlapped

1 Answer 1

1

Use raster calculator.

A=Con("lower" >= "upper", 1,0)

M = Cell statistics Mean

L=Con("A"==1, "M"," lower")

L represents new lower raster.

Note: naming doesn't matter. Important thing to set environment settings Extent, Snap raster and cell size

2
  • FelixIP, thank you! This worked very well. I might need to play around with the cell mean statistics to get exactly what I'm after, but this is the right track. I had tried some things in the Raster Calculator previously, but was not coming up with the right algebraic expressions as you did here, so thank you again. Commented Mar 28, 2016 at 20:49
  • Note your surfaces will become less smooth
    – FelixIP
    Commented Mar 28, 2016 at 20:51

Your Answer

By clicking “Post Your Answer”, you agree to our terms of service and acknowledge you have read our privacy policy.

Not the answer you're looking for? Browse other questions tagged or ask your own question.