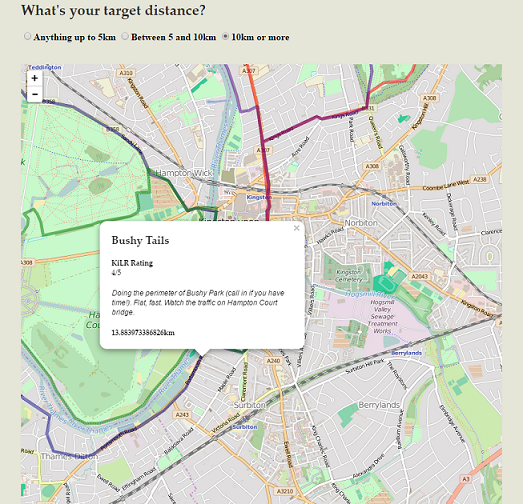
I am creating a web mapping application that will return appropriate routes based upon ST_length query on a cartoDB dataset. So far, the code below successfully maps those routes with individual colours and clears any others that may have previously been selected:
<script>
var myRoutes = null;

var sqlQueryOne = "SELECT *, ST_length(the_geom::geography)/1000 as length FROM my_routes WHERE ST_length(the_geom::geography)/1000 <=5";

// A function to set individual colours based on length
var determineColor = function(length) { // etc....

// Function to add all routes less than 5km
function showFive(){

//Remove any previously selected routes
    if(map.hasLayer(myRoutes)){
        map.removeLayer(myRoutes);
        };

// Get the data from db in geoJSON and using previously defined query
    $.getJSON("https://"+cartoDBUserName+".cartodb.com/api/v2/sql?format=GeoJSON&q="+sqlQueryOne, function(data) {
        myRoutes = L.geoJson(data,{
            onEachFeature: function (feature, layer) {
                layer.bindPopup('<h2><p>' + feature.properties.name + '</h2>' + '<p><b>KiLR Rating</b><br />' + feature.properties.ratings + '</p><em>' + feature.properties.highlights + '</em><br />' + '<p>' + '<b>' + feature.properties.length + "km" + '</b></p>');
                layer.cartodb_id=feature.properties.cartodb_id;
                layer.setStyle({
                   color: determineColor(feature.properties.length)
                   })
            }
        }).addTo(map);
    });
};
You can see that each route has a pop-up. What I would like to do is unload the other routes when an individual route is clicked (and keep the pop-up) so a user can more clearly see where the route actually goes (note some overlap in the routes).

Update: I now have what I think should be a working block to highlight the clicked route only from the layer.
This will style the clicked layer:
layer.setStyle({opacity: 1, width: 3, color: 'red'});
However I need some help implementing something to style the clicked and not clicked routes:
layer.on('click', function (e) {
    e.target.feature.properties.selected = true;
       layer.setStyle({
       color: highlightRoute(e.target.feature.properties.selected)});
    });
I appear to have lost the plot on writing the highlightRoute bit. So far (and I know this is not correct but don't know how to fix) I have:
    var highlightRoute = function (ml) {
        if (e.target.feature.properties.selected == true) {
            return 'red';
        } else {
            return 'gainsboro';
        }
    };
Can anyone help sort this little niggle out?
