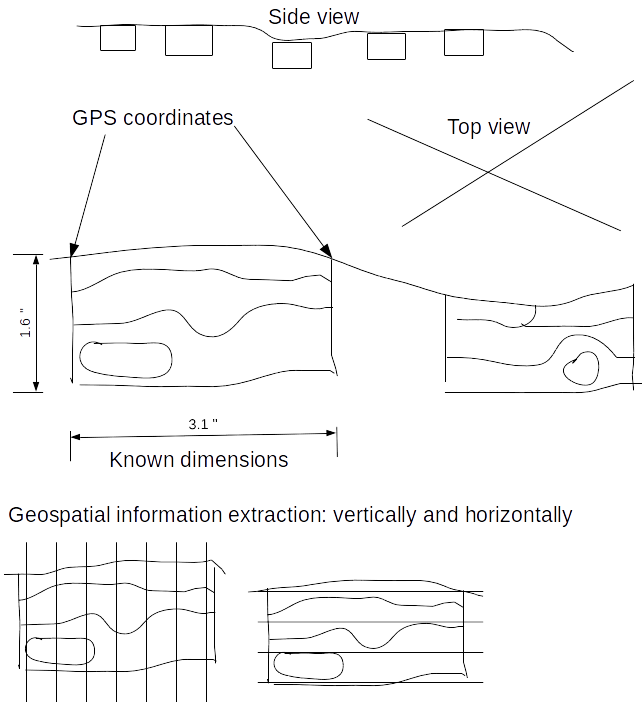
Here's a potential approach: I haven't tried this so your mileage may vary, but it should be quite doable (but it might require rather heavy-duty scripting). I'm starting to think in a similar direction for some projects I'm working on.
Ingredients:
- QGIS
- PostGIS (likely the best storage medium for relational data but others could potentially be used)
- Python (or maybe R or SQL)
First, digitize your data in QGIS - mostly as normal, but in pixel (!) space. This is a gentle misuse of GIS that requires you to fib about CRS information, but it's really the best tool for the job.
I'd store the data as Geometry objects in a PostGIS database (keyed to a unique ID per image) but other solutions (shapefiles per-image?) could be used as well. (PostGIS operates exceptionally well with QGIS though...) You can then key your DGPS points to the same image as well, and perhaps have an "image" table that contains the height of your measured section.
From this, you can write a script that puts each geometry through an affine transformation, mapping pixel coordinates to locations in 'real' space on a coordinate grid tied to your DGPS locations and depth. Basically, you map each image corner to a (location, depth) pair and fit your data between them. I won't go into the math here, but my answer here should give the general picture.
I'd do this using a Python script (with the sqlalchemy and geoalchemy2 modules), but it should be possible with a PostGIS SQL script (you'd have to have the image pixel dimensions in your database). You can then write this data to another Geometry column (or shapefile) in the coordinate reference system of your choice. This will leave you with (x,y,z) geometries in a GIS-digestible format.
This is a pretty hands-on method, to be sure, but I think it would leave you with a lot of room to customize, and a pipeline through which you can re-transform your data as you digitize more information.

