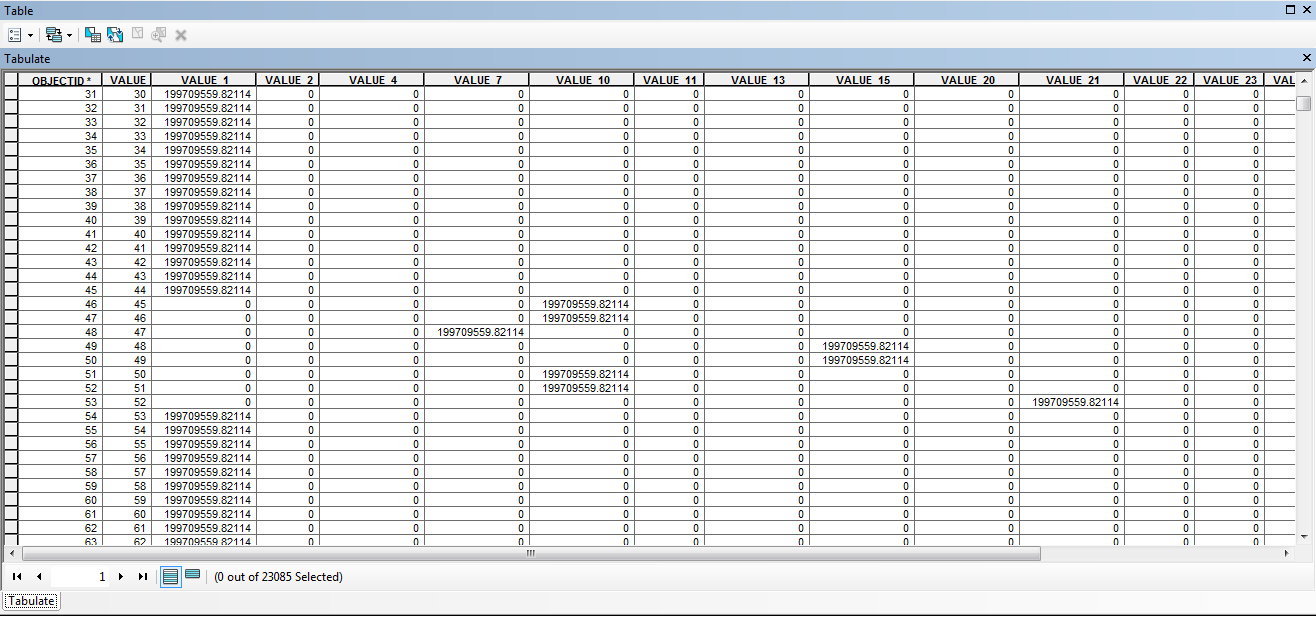
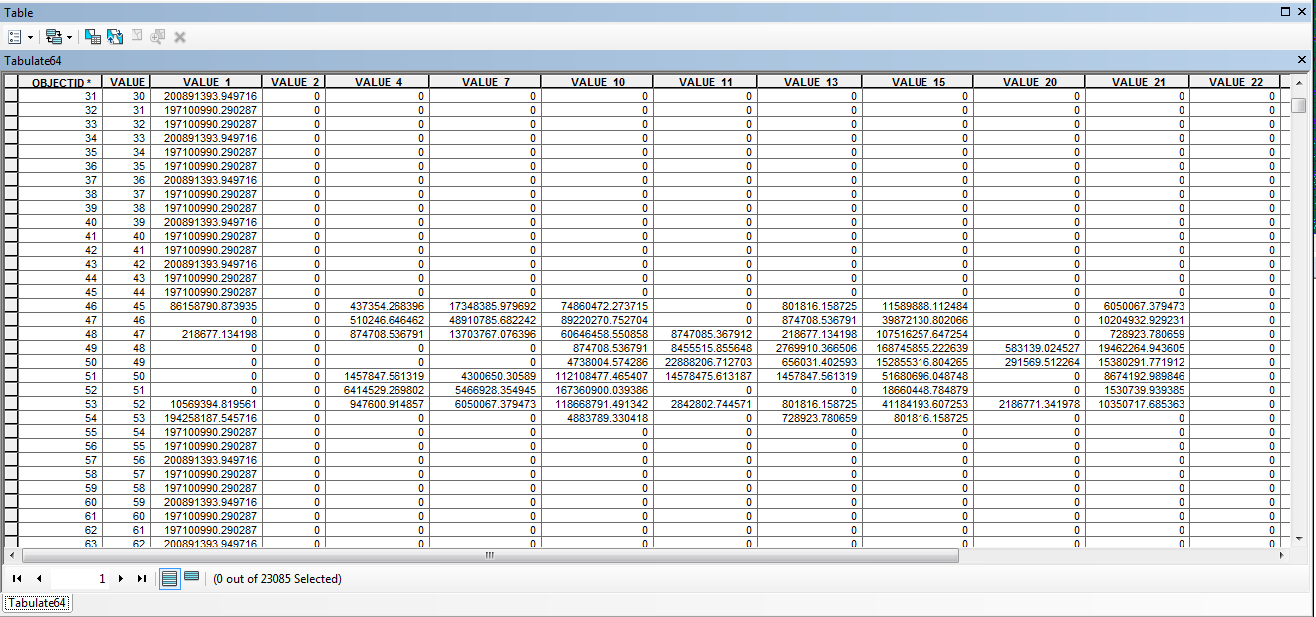
I have a raster of land cover (resolution roughly 300x300 m) and a raster grid of zones (cells about 14000x14000 m). What I need is to calculate the precentage of each land cover category within each zone. As far as I got, I found out that Tabulate Area is a pretty handy tool, although rather unpredictable. What troubles me most at the moment is that I need to automate this process, but within the Python script which saves the land cover dataset as a variable, I only get one category of land cover assigned to each zone.
custom_land_use_tif = "D:\\<path>\\custom_land_use.tif"
arcpy.gp.TabulateArea_sa(grid, "Value", custom_land_use_tif, "Value", "Tabulate")
However, when I run the TabulateArea line in Python Window within ArcMap and add the class layer which is loaded in the data frame, the results are plausible (nevermind the inaccuracies in the total area, although if anyone has any thoughts on that, it would be helpful as well).
arcpy.gp.TabulateArea_sa("grid", "Value", "custom_land_use.tif", "Value", "Tabulate")
Any ideas if there's a way to convince the tool to produce the second shown table within a script? I'm on ArcGIS 10.3 Basic.


