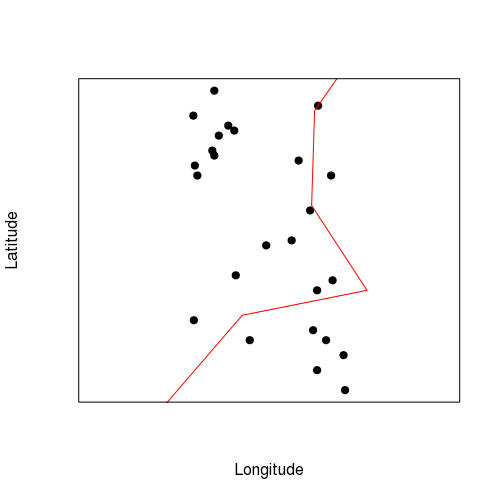
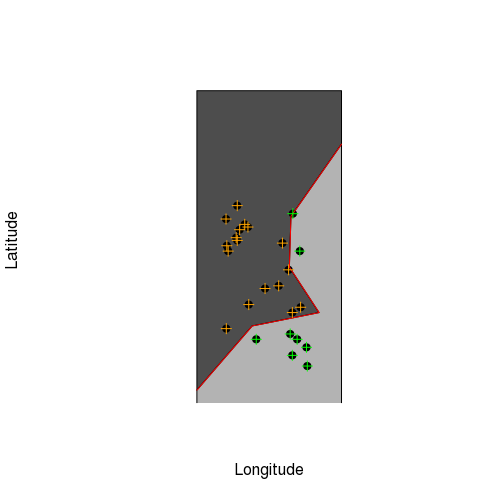
I need to subset the SpatialPoints object to get the points located in the left or in the right side of the SpatialLines object (red line, see figure below).
This is the code example in R:
# Load packages
library('sp')

# Load projection
epsg.32721 <- CRS("+proj=utm +zone=21 +south +datum=WGS84 +units=m +no_defs")

# Load data and create Spatial objects

# Sample points data
x <- c(790115.1, 790141.3, 790130.6, 790122.2, 790132.0, 790116.0, 790119.1, 790135.7, 790117.9, 790111.0, 790141.0, 790111.2, 790134.9, 790115.1, 790110.9, 790138.5, 790111.7, 790138.8, 790125.5, 790134.3, 790137.5, 790114.7, 790135.9, 790135.7, 790119.4)
y <- c(6193520, 6193460, 6193490, 6193470, 6193506, 6193511, 6193512, 6193480, 6193513, 6193474, 6193467, 6193505, 6193472, 6193507, 6193515, 6193503, 6193503, 6193482, 6193489, 6193496, 6193470, 6193508, 6193517, 6193464, 6193483)

# Sample points to SpatialPoints object
sampleSpatialPoints <- SpatialPoints(coords = cbind(x,y), proj4string = epsg.32721)

# Line data
x2 <- c(790100.0, 790120.7, 790145.7, 790134.6, 790135.2, 790154.1)
y2 <- c(6193451, 6193475, 6193480, 6193497, 6193516, 6193543)

# Line points to SpatialLines object
lineSpatialLines <- SpatialLines(LinesList = list(Lines(slinelist = list(Line(coords = cbind(x2,y2))), ID = "1")), proj4string = epsg.32721)

# Plot
plot(sampleSpatialPoints, xlab = "Longitude", ylab = "Latitude", pch = 19)
plot(lineSpatialLines, pch = 19, col = "red", add = TRUE)
box()


