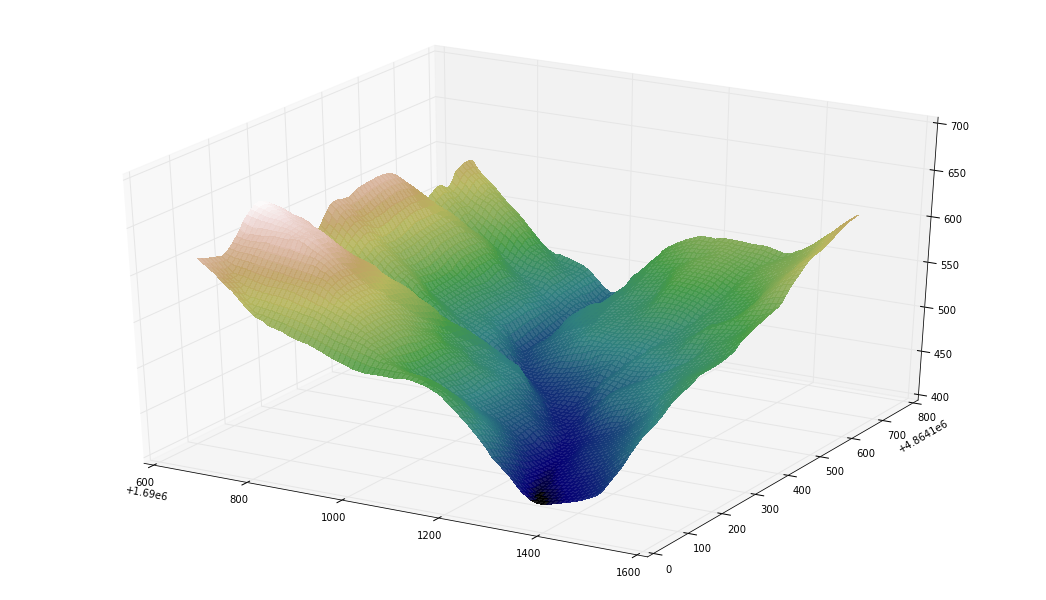
It is possible to overlay a geotiff, png or jpg to a surface_plot generated in matplotlib?
I want to display for example a smooth hillshade, geology or orthoimages. Another question... how to smooth the surface result?
This is the code I used to generate the plot:
#open terrain data using gdal
dtm = gdal.Open('AR.asc')
gt =dtm.GetGeoTransform()
banda1 = dtm.GetRasterBand(1)
xres = gt[1]
yres = gt[5]

# The bounding box of a shapely geometry
#used to filter a portion of digital terrain model

bb = geom.bounds
minx,miny,maxx,maxy = bb[0], bb[1], bb[2], bb[3]


inv_gt = gdal.InvGeoTransform(gt)
_x0, _y0 = gdal.ApplyGeoTransform(inv_gt, minx, miny)
_x1, _y1 = gdal.ApplyGeoTransform(inv_gt, maxx, maxy)
x0, y0 = min(_x0, _x1), min(_y0, _y1)
x1, y1 = max(_x0, _x1), max(_y0, _y1)
zi = banda1.ReadAsArray(int(x0), int(y0), int(x1-x0), int(y1-y0))

fig = plt.figure()
fig.set_size_inches(18.5, 10.5)
ax = fig.add_subplot(111, projection='3d')
plt.hold(True)
X = np.arange(gt[0], gt[0] + zi.shape[1]*xres, xres)
Y = np.arange(gt[3], gt[3] + zi.shape[0]*yres, yres)
X, Y = np.meshgrid(X, Y)
ax.plot_surface(X, Y, zi, alpha=.9, linewidth=0,cmap=plt.cm.gist_earth,antialiased=False,
                shade=False,rstride=1, cstride=1)
plt.show()

