6

I have a layer in QGIS which comes from a CSV with almost a million points. One of the columns of this csv is a datetime.

I would like the color of the points to be on a gradient depending on this datetime (e.g. oldest points in blue, newest in red, continuous gradient). I'm new to QGIS but know about the "Categorized" marker type, which allows me to have different markers depending on a field. Unfortunately I can only choose numerical fields there, and not text or datetime fields.

Is there a way to do this?

Alternatively, I could sort the source CSV by date. Is there a way to then use the "line number" to do the color gradient?

My CSV data looks like this:

Accuracy,Altitude,Bearing,Date Time,Date(GMT),Description,Distance,Latitude,Longitude,Name,Speed,_FileNames,Location,NAME_0,NAME_1,NAME_2,NAME_3,NAME_4,NAME_5,REGION,UID,Time elapsed
13.0,3089.800049,12.0,2013-03-16 18:03:00,,,24156.0,-13.322358,-72.049927,,10.5268,C:/Users/Alexis/Dropbox/Location/Aggregated.csv,Null,Peru,Cusco,Urubamba,Huayllabamba,,,,135966.0,0.0
26.0,2941.199951,17.20000076,2013-03-16 18:03:00,,,24156.0,-13.321477,-72.049874,,2.5,C:/Users/Alexis/Dropbox/Location/Aggregated.csv,Null,Peru,Cusco,Urubamba,Huayllabamba,,,,135966.0,0.0

Note that I have changed in the layer's properties-->fields, I have changed the field type to datetime, according to the datetime format in my data.

2
  • Could you provide a sample of your input data?
    – mgri
    Commented Jan 17, 2017 at 14:34
  • @HowToInQGIS Sure. I've added this in the question. Commented Jan 17, 2017 at 14:38

1 Answer 1

3

I created some other data starting from yours and it seems possible to use the datetime field for a categorized field.

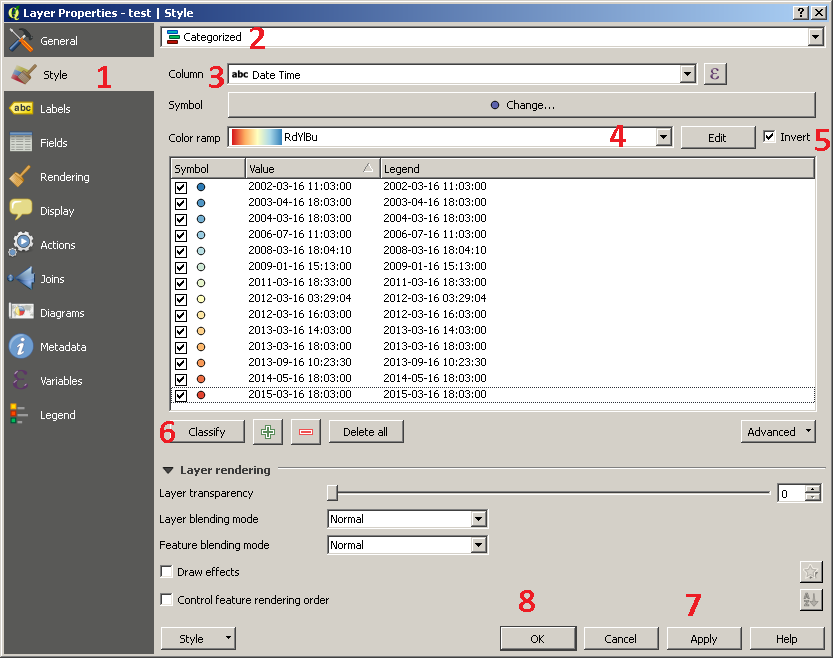
From Properties > Style, I set these options:

enter image description here

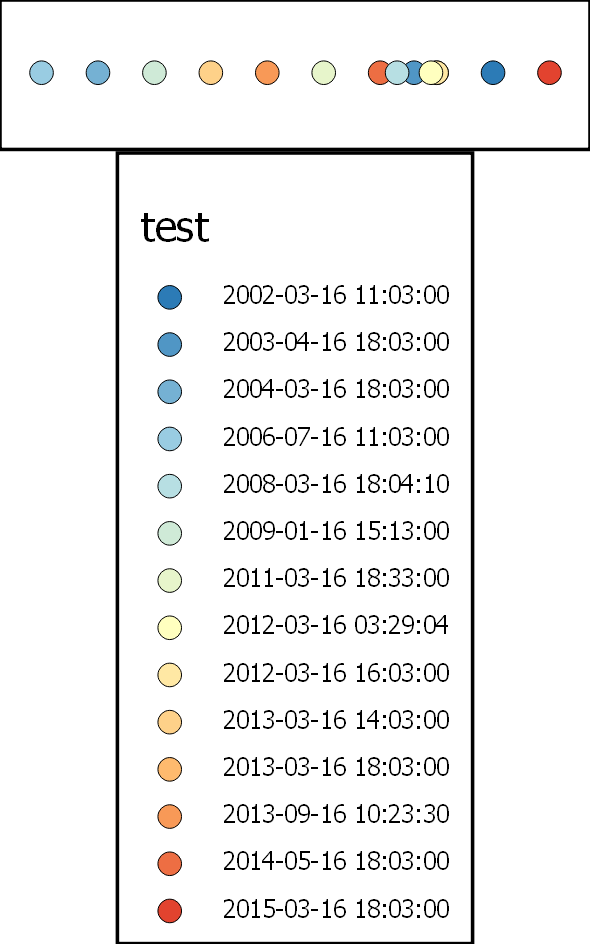
and I got this:

enter image description here

Is this the expected result or I'm missing something?

4
  • 1
    Thank you. It seems that there was a bug, but I was able to see the date and text fields in the "column" parameter, like in your screenshot, after restarting QGIS. However putting a million point on a continuous gradient seems to make QGIS unresponsive, as opposed to Tableau where it works quite well. One thing I could do would be to use a smaller number (e.g. 100) of categories, but QGIS doesn't seem to give me the option of upper and lower boundaries to define categories for date-time fields. Commented Jan 17, 2017 at 19:33
  • I did a test and you are right about the impossibility of using date-time fields for graduated styles. However, I think you could try to manage a categorized style for one million of points recurring to python: this should be a new separate question, for which I could try to give you a solution. Instead, if my answer was correct, please accept it to help the other users when looking for a similar solution =).
    – mgri
    Commented Jan 17, 2017 at 19:43
  • I am now testing with QGIS 3.34, and I am able to use date and datetime fields in the Graduated symbology, but the classifying on the data does not work as expected (all 0 to 0 values and legend). Wondering if it's a bug or still a feature that needs implementing.
    – stragu
    Commented Sep 5 at 6:32
  • I have reported it as an enhancement request on GitHub: github.com/qgis/QGIS/issues/58636
    – stragu
    Commented Sep 10 at 13:02

Your Answer

By clicking “Post Your Answer”, you agree to our terms of service and acknowledge you have read our privacy policy.

Not the answer you're looking for? Browse other questions tagged or ask your own question.