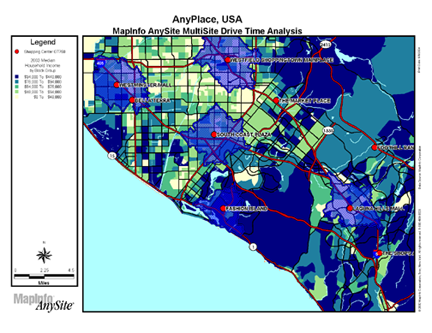
I am interested in creating some customer-derived trade areas that represent "most" of the customers for a given store (say 80%). I have both the customers and the stores geocoded.
The ESRI Business Analyst description of the general idea (with pictures) is here. Unfortunately I work at a MapInfo shop, so I am trying to hack it together myself. Does anyone know if something like this exists already so that I don't have to reinvent the wheel?
Here's a summary of what I've tried so far:
I've start at the store, ranking the customers from closest to farthest, and then adding each customer in until I get to ~80% of sales for each store. Then I put the convex hull around those folks and call that the trade area. This works reasonably well, but it misses major customers who happen to be distant.
I've also tried ranking the customers in terms of sales, from largest to smallest. Then I keep the ones who make up the 80%, and then snap a convex hull around them. This gets the big guys, but I loose the 80% feature since that area now includes lots of the small shrimp.
I've also tried a hybrid approach where calculate z=sales/(straight line distance) for each customer, rank by z, and put CH around the folks that add up to 50%. That CH will also include other customers that were not selected, and so I then trim the farthest customers in the hull until I get back down to 80% of sales. This works the best of the 3 methods.
Any advice would be greatly appreciated.

