I am working with a Radiometric TIFF and trying to find a way to make finding anomalies within the raster quicker.
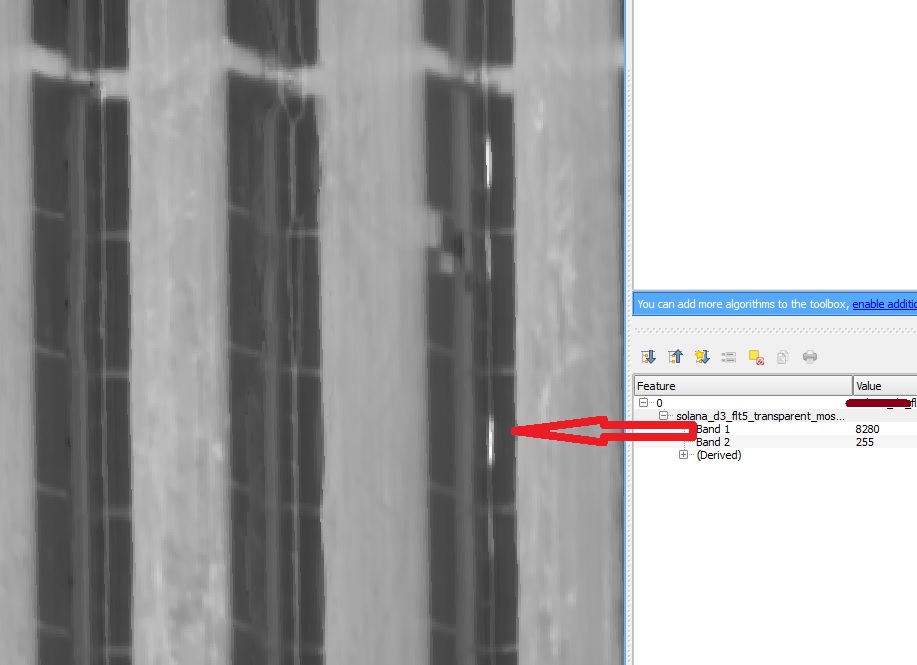
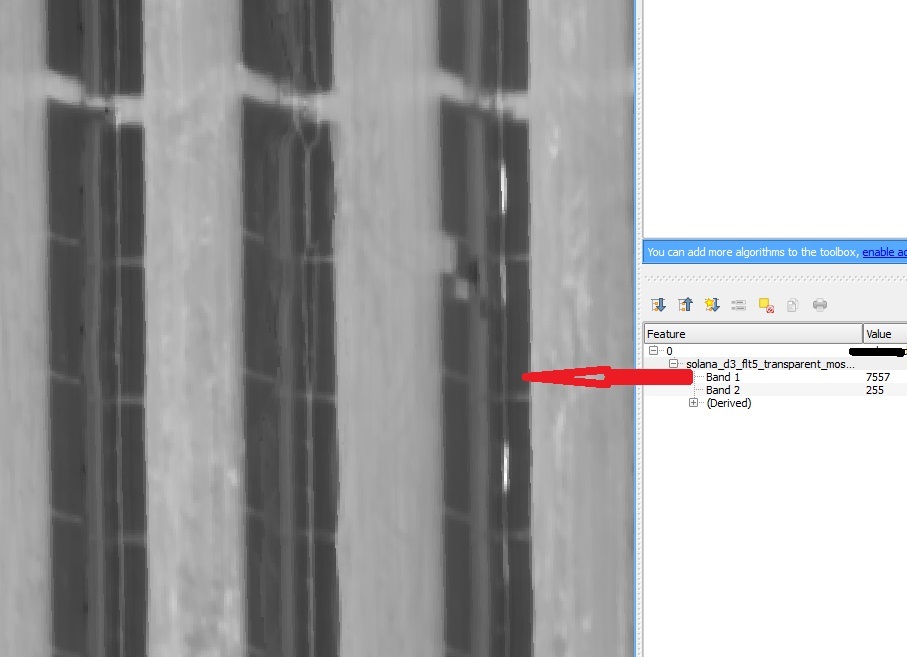
The image is an orthorectified mosaic of many images of a concentrating solar site. The site is comprised of parabolic mirrors with a glass tube that runs down the middle. As tubes break or start to fail, they will become hotter than normally operating tubes.
When a tube is failed it is fairly obvious to the eye when looking through the orthomosaic. However, with 100,000 tubes over 2000 acres, I am looking for a way to have the raster styled or to clip out only the failed tubes based on their thermal fingerprint. A failed tube, based on the altitude flown, is approximately 10 pixels long, 1-2 pixels wide and are significantly hotter than the pixels surrounding it.
Issues however, are that these images are taken over multiple days and varying temperatures. 1/2 of the tubes are on the "return side" and are cooler and 1/2 are on the "heated" side and are hotter. Hot tubes found in the morning may be the same temperature as normal tubes in the afternoon. Surrounding ground structures are also sometimes in the same temperature range as the failed tubes. Even though temperatures vary throughout the site - the fingerprint is still the same. a connected string of 10 pixels or so hotter than the adjacent pixels.
Is there a way using the raster calculator to enter a formula that would match this fingerprint? Is there a way to use styling to color only those temperatures in the failed range and clip out all other?
I have a shapefile of the entire site that I could use for a mask with polygon features for every tube I can use as a constraint to the calculation if that would be possible?
I added two images... because I can't add more than that :(
1) "broken" is a broken tube showing the pixel value for the broken tube
2) "adj_normal" is a normal tube next to the broken tube
3) would have been an image of the lighter shade tube under the broken that is failed, but not broken. It's pixel value was 7714
4) would have been a general site image not zoomed in to show a larger section but really has no baring on the problem, was just for reference.


