You do not need a plugin. Everything is in the class QgsPoint of PyQGIS
If you examine the contents of a QGIS point class with the Python built-in function dir() in the Python Console.
dir(point])
['__class__', '__delattr__', '__dict__', '__doc__', '__eq__', '__format__', '__ge__', '__getattribute__'
, '__getitem__', '__gt__', '__hash__', '__init__', '__le__', '__len__', '__lt__', '__module__',
'__ne__', '__new__', '__reduce__', '__reduce_ex__', '__repr__', '__setattr__', '__sizeof__',
'__str__', '__subclasshook__', '__weakref__', 'azimuth',
'multiply', 'set', 'setX', 'setY', 'sqrDist', 'sqrDistToSegment', 'toDegreesMinutesSeconds', 'toString', 'wellKnownText', 'x', 'y']
You can see there are azimuth and sqrDist functions and after a few tries:
- xy[0].azimuth(xy[1]) or xy[1].azimuth(xy[0]) gives the azimuth direction between two points(in degrees, +/- 180°)
- xy[0].sqrDist(xy[1]) give the square distance between two points (in the unit of the project)
The problem

So in the Python console
def select_all(layer):
     layer.select([])
     layer.setSelectedFeatures([obj.id() for obj in layer])

myline = qgis.utils.iface.activeLayer()
select_all(myline)
for elem in myline.selectedFeatures():
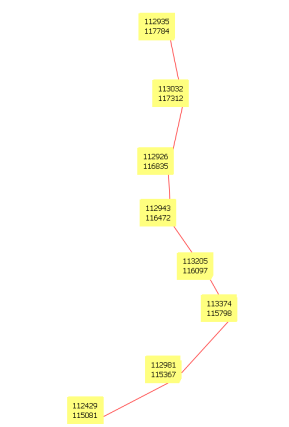
      xy = elem.geometry().asPolyline()
now xy contains all the nodes (points) of the line
# first point
print "x=%2d y=%2d" % (xy[0].x(),xy[0].y())
x=112935 y=117784
# and others...
Using all node points of the line:
1) azimuth point i to point i + 1 (+/- 180°) (nodes of a line)
for i in range(len(xy)-1):
     print "x=%2d y=%2d azim=%6.1f azim2=%6.1f" % (xy[i].x(), xy[i].y(), xy[i].azimuth(xy[i+1]), xy[i+1].azimuth(xy[i]))

x=112935 y=117784 azim= 168.4 azim2= -11.6
x=113032 y=117312 azim=-167.5 azim2=  12.5
x=112926 y=116835 azim= 177.3 azim2=  -2.7
x=112943 y=116472 azim= 145.1 azim2= -34.9
[...]
2) euclidean distance between point i and point i + 1
for i in range(len(xy)-1):
     print "x=%2d y=%2d dist=%6.1f" % (xy[i].x(), xy[i].y(), xy[i].sqrDist(xy[i+1]))

x=112935 y=117784 dist=232533.9
x=113032 y=117311 dist=238243.6
x=112926 y=116835 dist=131839.8
x=112943 y=116472 dist=209268.1
[...]
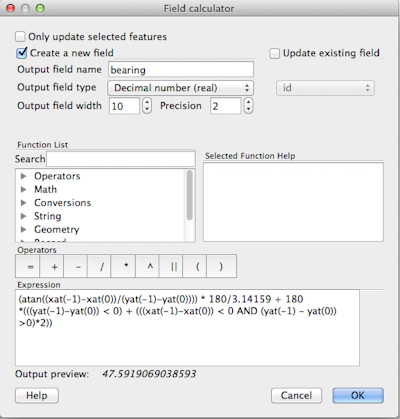
After, it is not very difficult to add these values to the attribute table.
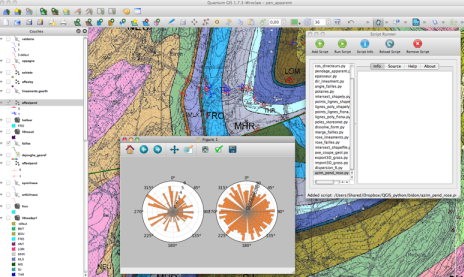
I use this technique to analyze the lineaments (geology) with matplotlib and the Script Runner plugin


