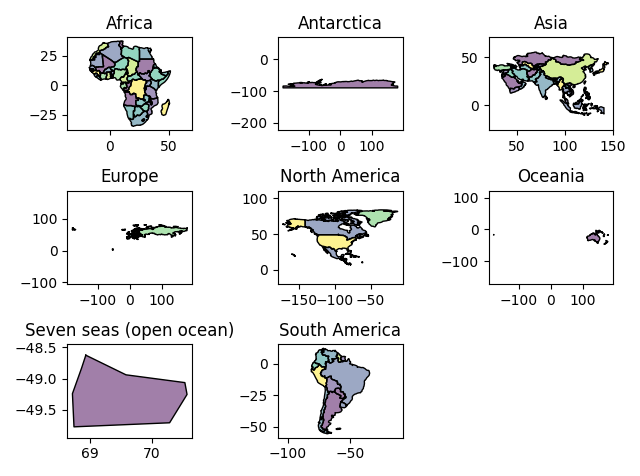
If you want to represent the continents side by side, you have to create subplots on the same fig. To do so, you can iterate through your group of continents. Here is an example:
import geopandas as gpd
import matplotlib.pyplot as plt

world = gpd.read_file(gpd.datasets.get_path('naturalearth_lowres'))
continent = world.groupby('continent')

plt.figure()

# Iterate through continents

for i, (continent_name, continent_gdf) in enumerate(continent):
    # create subplot axes in a 3x3 grid
    ax = plt.subplot(3, 3, i + 1) # nrows, ncols, axes position
    # plot the continent on these axes
    continent_gdf.plot(ax=ax)
    # set the title
    ax.set_title(continent_name)
    # set the aspect
    # adjustable datalim ensure that the plots have the same axes size
    ax.set_aspect('equal', adjustable='datalim')

plt.tight_layout()
plt.show()
yields


