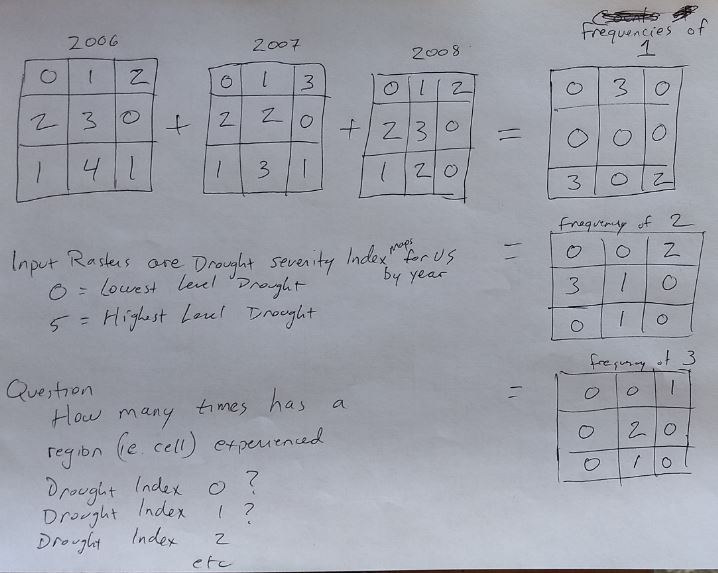
I am interested in drought occurrences in the US, especially how often droughts of a particular severity occur in particular regions. I’ve got nice vector maps from http://droughtmonitor.unl.edu showing drought severity for each year (scale of 0 - 4, with 0 = minor drought and 4 = extreme drought) for 2006 - 2017. I’ve converted the vector maps to rasters, all with the same extent and cell size.
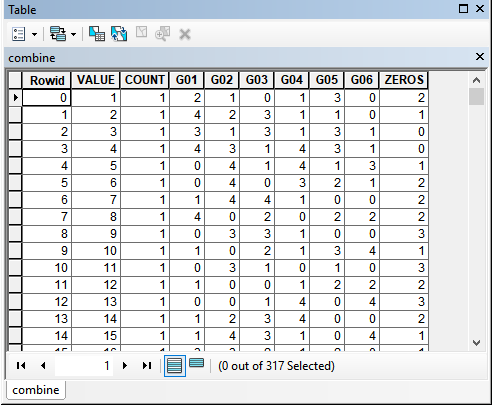
Using ArcMap 10.5 (and prob Spatial Analyst), I want to count how many times a drought index of each level has occurred in a given region (i.e. raster cell) over the 10 year period. I’m imagining inputting the 10 yearly maps and ending up with 5 output rasters, each holding the count of drought level for each cell. So far I haven’t found a way to count occurrences across multiple rasters. I don’t want sum or weighted average, I want counts. Any suggestions?


