3

I have a set of parallel lines where the default distance between them is 1.4m, I need to identify where that distance is greater or less than the default:

Example

I have a sample file where it was done but I do not know how it was calculated nor how the points were generated: enter image description here

The atribute table os points shp: enter image description here

Searching in GIS, I found this topic with an answer that seems to be the solution, but I do not know how to reproduce for a set of lines. I quote:

"You bet. There are a bunch of ways you can do it, but here's one potential method @Rashomon. For the set of points along each river bank, add new fields to the attribute table for Xcoord and Ycoord. Then open field calculator and use the $x and $y functions to populate the fields. You can then use anything you want to compute a simple average of the two sets of coordinates. Even Excel will work. Then just plot your new x and y coordinates that correspond to the center of the river. – lambertj Jan 25 at 16:44"

Create a center line between 2 polyline - QGIS

Solutions I thought:

  • Create a buffer in the 70cm lines and then identify where they overlap or do not touch, but I do not know how to calculate this.
  • Create centerlines between parallel lines, extract nodes every 1mt for example, and measure the distance to parallel lines.

There are many lines, thousands, it would need to be an automated solution as much as possible, it could be matlab, python, r or some other, or qgis or arcgis.

The sample files: https://drive.google.com/drive/folders/1XKOUECG3bY2claSqwQ-S9-C-yjYjE0r7?usp=sharing

2
  • 2
    Instead of producing points, it seems lines would be more appropriate. Lines could be generated between two neighboring input lines wherever the input lines differ more than some tolerance from the default distance. Commented Jun 22, 2018 at 23:40
  • It can be lines too, no problems. Any ideas on how to proceed?
    – hugonbg
    Commented Jun 23, 2018 at 1:58

1 Answer 1

3

QGIS 3.0

Here I used QGIS distance() expression, which returns minimum distance between geometries. I worked only on the line layer, which may not be an answer you anticipated, but hope it helps.

(1) Reprojection

  • It seemed the data both in geographic - latlong.
  • I reprojected line layer to XY (UTM) using EPSG: 31982.

(2) Re-order the lines

  • It seemed the fid of the line layer was not related to their relative position. Created a new field (center_y) to store y-coordinates of center point by y(centroid($geometry)).
  • Re-ordered the attribute table, by center_y field by Order by expression tool (ascending so that the southernmost line comes first on the attribute table). This function returned a new layer Output layer.
  • Then created an id field by @row_number.

(3) Calculate the distance between lines

  • Expression: distance(geometry(get_feature_by_id('Output layer', $id+1)),$geometry)

(4) Find extreme values

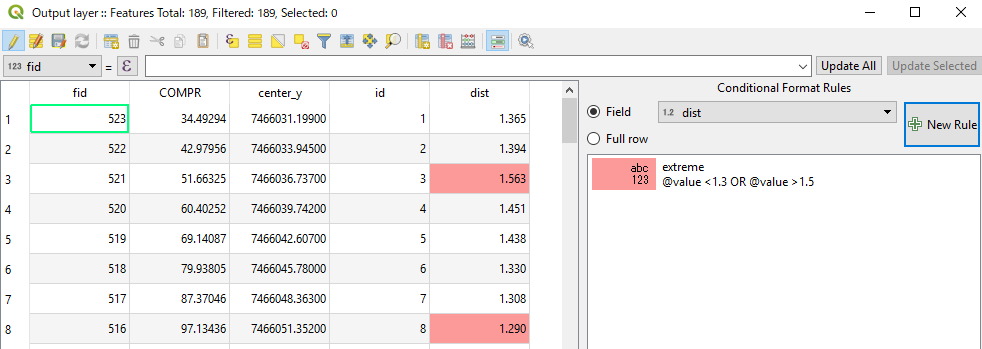
  • On the attribute table, there is Conditional formatting option.
  • Created a new rule with a condition @value <1.3 OR @value >1.5

enter image description here

I used QGIS 3.0.3 to use Order by expression but if you are working in QGIS 2.18 MMQGIS or Sort and Number plugins can order the field. [EDIT] (My apologies... I realized get_feature_by_id() was newly added in QGIS 3.0, so this answer requires QGIS 3.0 anyway).

9
  • Thank you very much @Kazuhito! I followed your instructions and I was able to reproduce here! That was it! One question, if I divide the original lines into 10m to 10m segments, is the procedure the same? Do I need to adjust anything or just follow their instructions? Could you please tell me some book, tutorial, video to study? I really enjoyed these functions, they were very helpful.
    – hugonbg
    Commented Jun 23, 2018 at 1:36
  • 1
    @hugonbg I'm glad it worked out for you. Thank you. About the case of segmented lines, sorry I honestly don't know. However, as long as such segments can keep original id field, it may be used to identify "the next line" which is the essential part of the function (i.e. id+1).
    – Kazuhito
    Commented Jun 23, 2018 at 2:01
  • 1
    @hugonbg And I cannot agree with you more, these functions are so amazing and interesting. Because QGIS development is very fast, tutorials and/or books become immediately too old at the time of publication. I usually read the help of the Field Calculator, which shows up when we click on the function. HTH.
    – Kazuhito
    Commented Jun 23, 2018 at 2:18
  • Can a heat map be created using distance field values.
    – HansrajR
    Commented Jan 18, 2021 at 11:54
  • @HansrajR Can you expound the context of your question?
    – Kazuhito
    Commented Jan 18, 2021 at 12:41

Your Answer

By clicking “Post Your Answer”, you agree to our terms of service and acknowledge you have read our privacy policy.

Not the answer you're looking for? Browse other questions tagged or ask your own question.