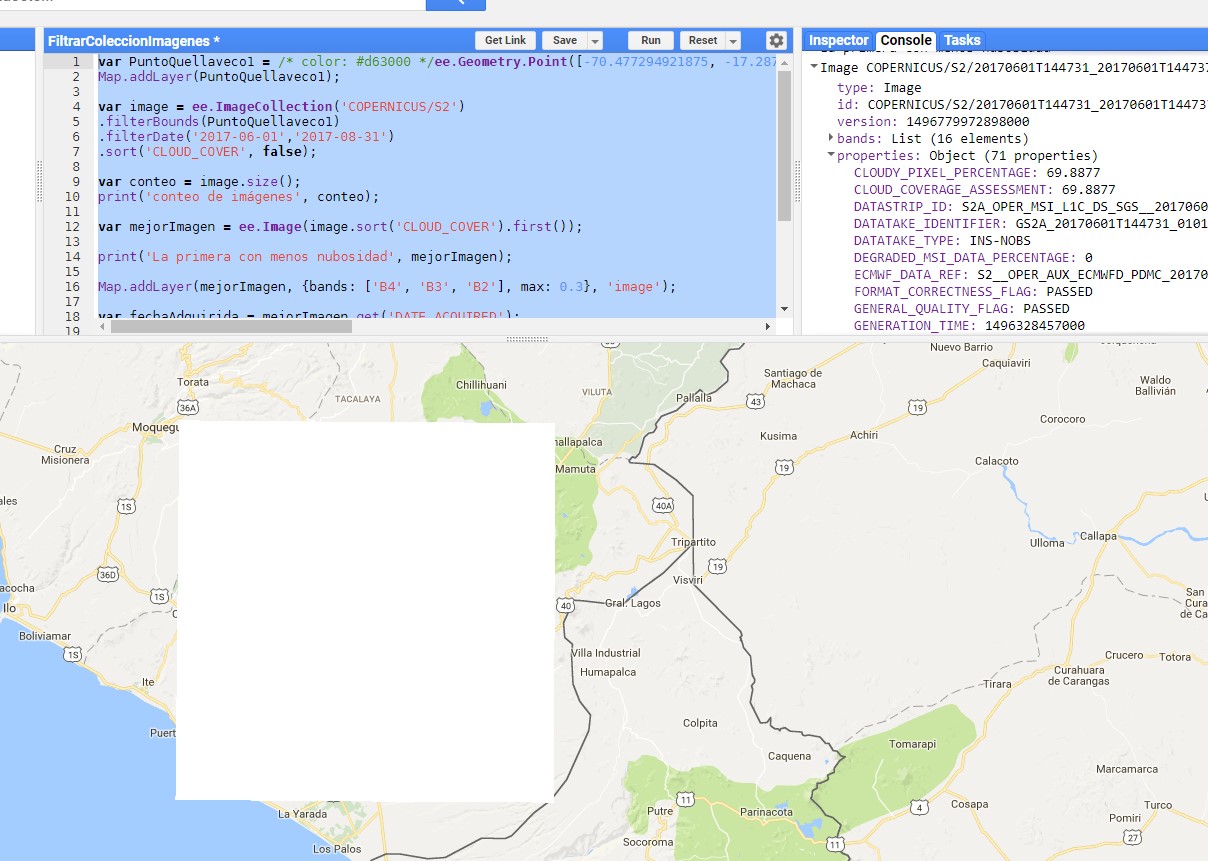
I'm trying to display SENTINEL-2 imagery in Google Earth Engine, code working but displaying blank figure:
var PuntoQuellaveco1 = /* color: #d63000 */ee.Geometry.Point([-70.477294921875, -17.287709050621917]);
Map.addLayer(PuntoQuellaveco1);

var image = ee.ImageCollection('COPERNICUS/S2')
.filterBounds(PuntoQuellaveco1)
.filterDate('2017-06-01','2017-08-31')
.sort('CLOUD_COVER', false);

var conteo = image.size();
print('conteo de imágenes', conteo);

var mejorImagen = ee.Image(image.sort('CLOUD_COVER').first());

print('La primera con menos nubosidad', mejorImagen);

Map.addLayer(mejorImagen, {bands: ['B4', 'B3', 'B2'], max: 0.3}, 'image');

var fechaAdquirida = mejorImagen.get('DATE_ACQUIRED');

print('Fecha adquirida', fechaAdquirida);


