1

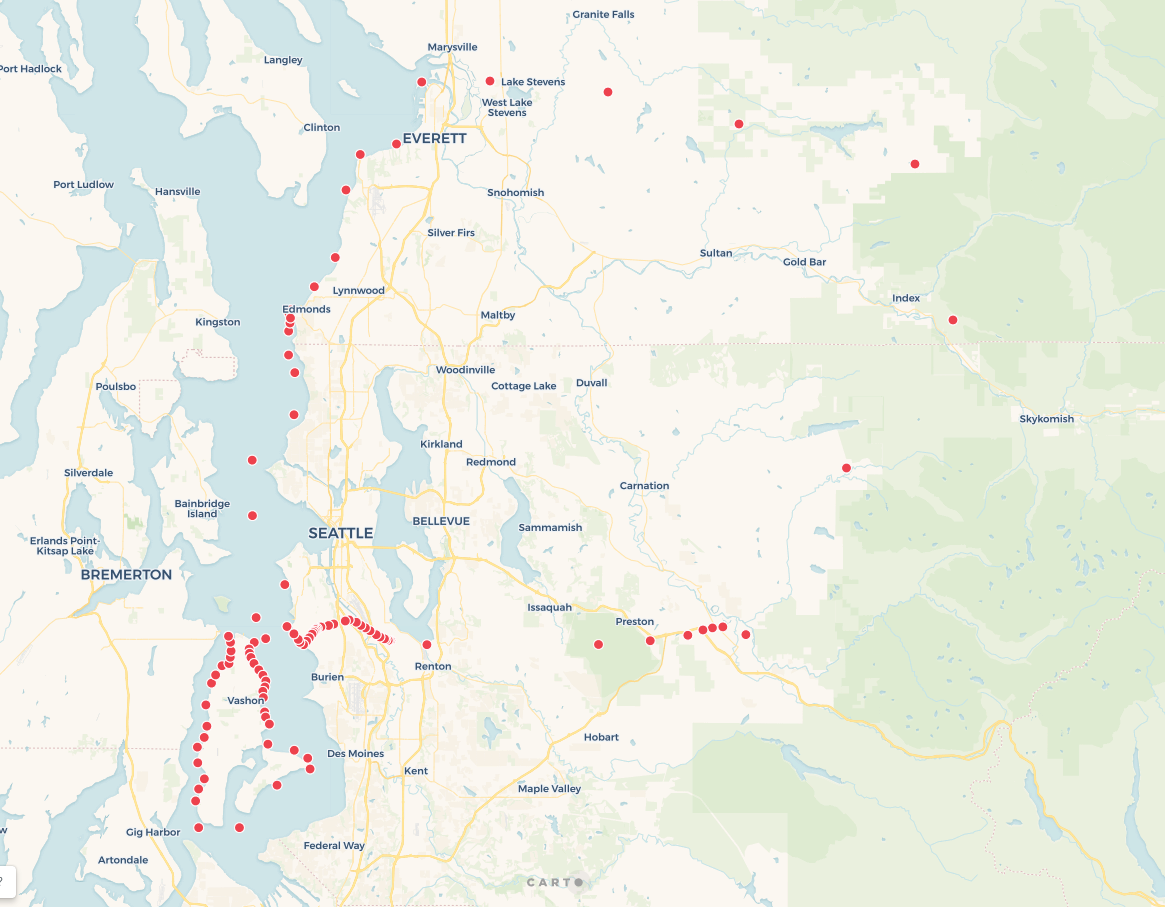
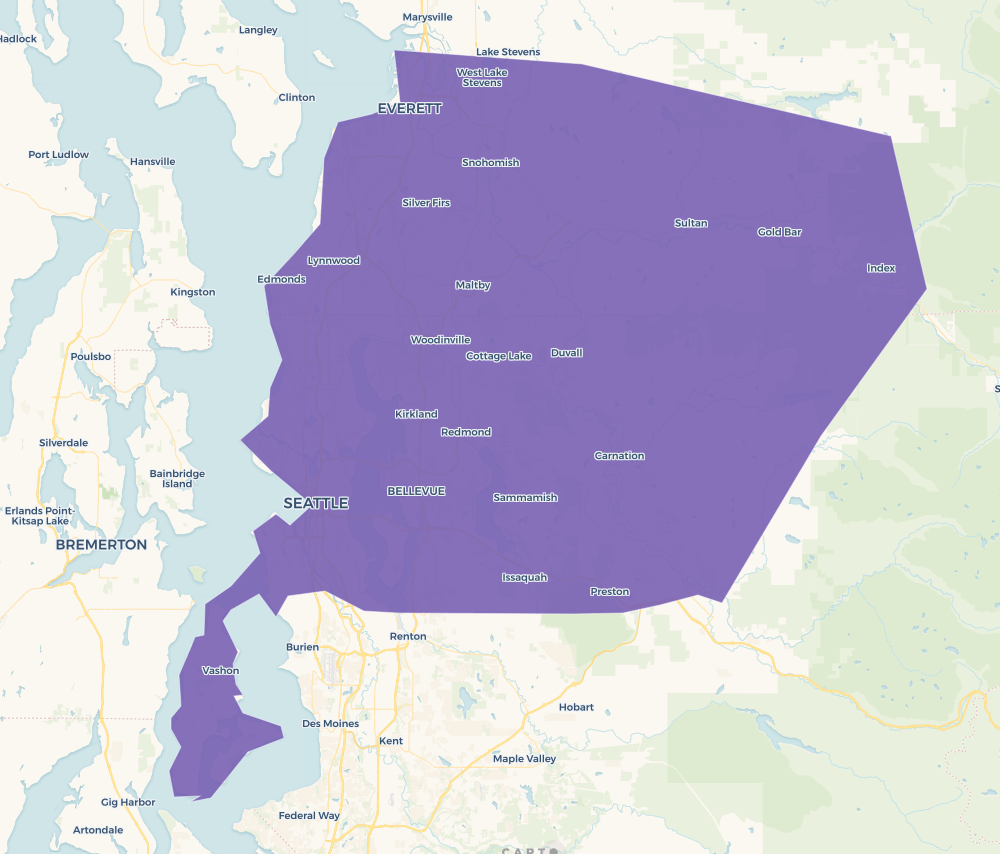
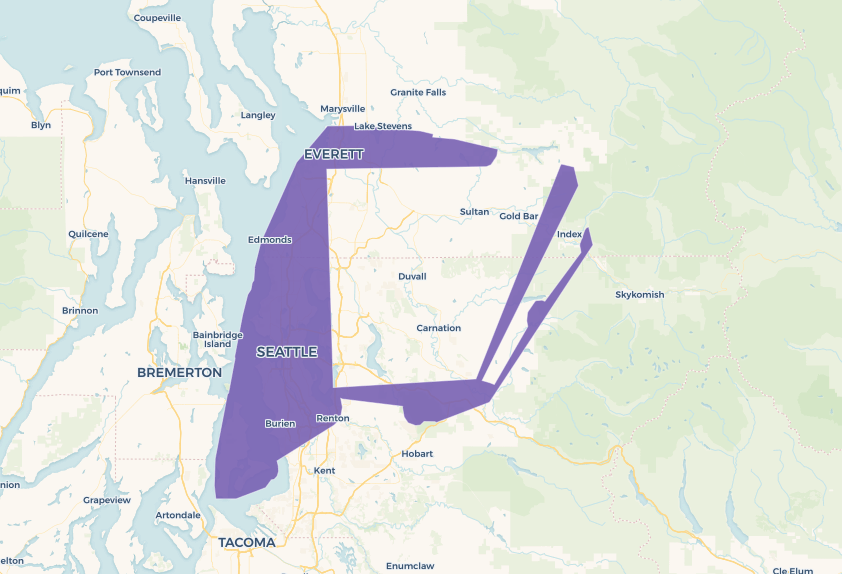
Using Carto, I am trying to create shapefiles of regions using points(Link to Dataset in Carto ) with a shared column value to group by. I've included 3 photographs. 1st photograph of the points outlining the shape. the second photo is my desired result which I have drawn out by hand. The third photo is an attempt that does not meet my desired result.

I am using the analysis tool provided by Carto, running a concave hull and have tried various target percent values and without the desired results. For this example I've included a target percent of 80 and the result is shown in a photograph at the bottom. The code is provided below

  SELECT row_number() over() as cartodb_id,
         territoryid as category,
         ST_ConcaveHull(
             ST_Collect(the_geom), 
             0.8, 
             false
          ) AS the_geom,
         count(1) as count_vals
    FROM (
         SELECT *
           FROM ( SELECT * FROM "st-braund".bd_regions_1 ) _camshaft_category_filter
          WHERE territoryid IN (3)
         ) _analysis_source
GROUP BY territoryid

Shape Outline with Points

Desired Shapefile

Failed Attempt

5
  • 1
    Can you elaborate on your question? I can see two concave polygons the second with a higher percent value, so I don't understand where the issue is. What do you mean by poor results? What were you expecting?
    – Jorge Sanz
    Commented Aug 20, 2018 at 8:28
  • how's the result in the range between 0.99 and 0.90?
    – geozelot
    Commented Aug 20, 2018 at 20:10
  • thanks for the input @ThingumaBob! at 99 seemed to have closest to the desired result.
    – Sbraund
    Commented Sep 12, 2018 at 0:45
  • @JorgeSanz is it possible to write an order by statement after the group by statement?
    – Sbraund
    Commented Sep 12, 2018 at 1:00
  • yep @Sbraund, you can always wrap your query and put your ordering outside WITH a AS (myquery) SELECT * FROM a ORDER BY b
    – Jorge Sanz
    Commented Sep 13, 2018 at 7:02

1 Answer 1

0

The solution I found for the above problem was to

Create Lines from the points --> Close the Lines --> then make a polygon from closed lines.

SELECT row_number() over() AS cartodb_id, *,
  ST_Length(the_geom_webmercator::geography) as length FROM (
  SELECT territoryid as category
   , ST_MakeLine(the_geom ORDER BY bd_territories_coords_id asc) AS the_geom_webmercator 
  FROM (
    SELECT * FROM "st-braund".template_localities_1 ) _line_sequential
  GROUP BY territoryid ) _cdb_analysis_line_sequential

Your Answer

By clicking “Post Your Answer”, you agree to our terms of service and acknowledge you have read our privacy policy.

Not the answer you're looking for? Browse other questions tagged or ask your own question.