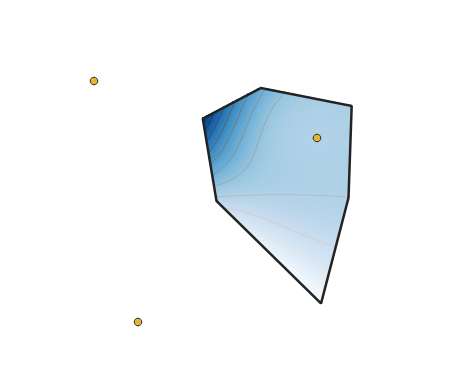
I have a specified geometric boundry with three data sets that correspond to rainfall measurements at three stations of which two are outside of the geometry and one inside. I would like to find a rainfall distribution (no matter how approximate it is) for the whole geometry according to these three data sets. How could I do this?
1 Answer
A very basic approach would be to interpolate a raster using the IDW Interpolation tool:
- open
Processing Toolbox | Interpolation | IDW Interpolation- select your station layer as
Vector layer - select your measurement field as
Interpolation attribute - add the layer setup by hitting the
+button - choose
Extent | ... | Use layer/canvas extentUse extent from | <your_boundary_layer>
- hit
Run in Background
- select your station layer as
- open
<QGIS> | Raster | Extraction | Clip Raster by Mask Layer- choose the raster layer from above as
Input layer - choose your boundary layer as
Mask layer - hit
Run in Background
- choose the raster layer from above as
It might be worth fiddling with the interpolation options to see if you get better results as with the defaults.
Clipping is optional, of course. Also, you could choose a different extent, e.g. the current canvas extent or yet another vector layer.
You could then extract contours as isohytes via <QGIS> | Raster | Extract | Contour...
Very simple example:
-
Thank you very much. I think i found what I was looking for! Commented Sep 28, 2018 at 16:14
-
@ReyhanehS.Ghazanfari nice! did my answer help? if so, consider upvoting (up-arrow) or even accepting (hit the tick) it.– geozelotCommented Sep 28, 2018 at 16:33
-
Yes, what you explined and got in the figure was exactly what I was looking for. I just have some difficulties in applying the technique that you explained. First, I dont know how i should prepare the «attribute table column». What I have is a .txt file with the coordinates (x,y) of the three stations and another text file including their corresponding precipitation in three columns. I did not understand where shall I impose the measurement (precipitation data field that I have. My data is not in one single column. Secondly I dont find this + button to hit for the layer setup. Commented Oct 2, 2018 at 21:10
-
I would be thankful if you could help with these two issues as well. Commented Oct 2, 2018 at 21:13
-
I forgot to mention that the precipitation data for each station includes the amount of daily precipitation over the course of 30 years that is stored in one column for every station. Commented Oct 2, 2018 at 21:50

