1

I'd like to extract a list of polygons from a SpatialPolygonsDataFrame that include more than one area (so a polygon with a hole for example, or just 2 areas in one polygon entry in general). There was a question answered previously which was very close to what I want but it wasn't testing for whether or not more than one area was listed, and it did not preserve the indices for which polygon had more than one area listed within it.

In the answer posted by @cengel, there are ways to list all the areas of the polygon, to get a list of polygons in the file, and to get the areas of a prespecified polygon, which is close but not what my specific question is:

-Example poly from cited question (without holes or multiple areas)

mp <- readWKT("MULTIPOLYGON (((30 20, 45 40, 10 40, 30 20)),((15 5, 40 10, 10 20, 5 10, 15 5)))")

-total area

sapply(slot(mp, "polygons"), slot, "area")

-get list of individual polys

p <- lapply(mp@polygons , slot , "Polygons")

-areas of individual polygons

lapply(p[[1]], function(x) slot(x, "area"))

My structure looks more like this:

enter image description here

And the polygons with multiple areas like this: enter image description here
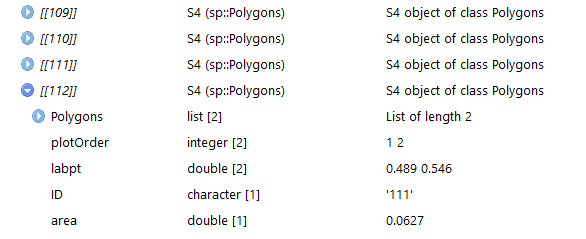
There are two areas even though for some reason they don't show up in the list. I can plot them individually by using:

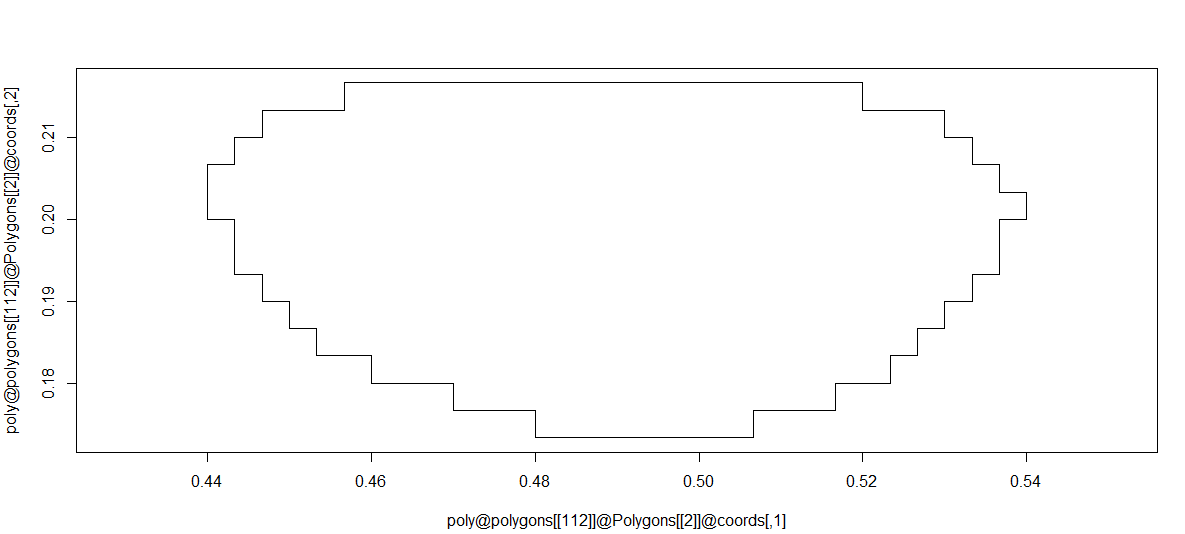
plot(poly@polygons[[112]]@Polygons[[2]]@coords,type = "l", asp=1) 

(this is showing that I'm plotting the 2nd of 2 areas)

enter image description here

So basically, I'd like a list of which polygons have areas with more than one entry, but also which polygons those are (the index).

10
  • So if you just had the index that would be enough because you could simply subset the original data?
    – Spacedman
    Commented Dec 11, 2018 at 18:40
  • You say "There are two areas even though for some reason they don't show up in the list." but what list are you talking about?
    – Spacedman
    Commented Dec 11, 2018 at 18:43
  • Can you make a properly reproducible example?
    – Spacedman
    Commented Dec 11, 2018 at 18:49
  • @Spacedman so when I flatten the list the different areas are shown and also when I plot the index of area 2 it shows a shape. So it just doesn't display that 2nd or 3rd area in the list. The list length is also [2] or more, rather than [1] as seen in the screenshot. And a list of only the indices would be helpful, but ultimately it would be nice to be able to pull out the corresponding areas also. Thank you! Commented Dec 12, 2018 at 14:25
  • @Spacedman, please find a polygon file here with the flattened area list: drive.google.com/open?id=1BscNa83gaJHseOeYMNYJEDafRMWTAf_x drive.google.com/open?id=1dV3B-y-ZdoI80ju9r2S0F9EX36C-nWuN In the spatialpolygonsdataframe file, polygon #301 (#302 in the area list) is one that has 2 areas listed. So it would be great to know 'oh, this polygon lists 2+ areas, and which polygon it is" Commented Dec 12, 2018 at 14:45

1 Answer 1

1

Guessing time until you clarify...

Let's use this data set from the spData package:

> nc <- readOGR(system.file("shapes/sids.shp", package = "spData")[1])

Let's use this function to count the number of component polygons in the Polygons slot of each row:

> multi = function(spdf){
    sapply(spdf@polygons, function(p){length(p@Polygons)}) >1 }

So it returns true or false:

> multi(nc)
  [1] FALSE FALSE FALSE  TRUE FALSE FALSE ... etc

Plot the multu polys with some colours so you can see the parts:

> plot(nc[multi(nc),], col=1:10)

And if you want row indexes you can have them:

> which(multi(nc))
[1]  4 56 57 87 91 95

and if you want to subset you can do that too.

Your Answer

By clicking “Post Your Answer”, you agree to our terms of service and acknowledge you have read our privacy policy.

Not the answer you're looking for? Browse other questions tagged or ask your own question.