0

I have UTM coordinates data XY and Z which shows the presence of mountain. For Z, I have just binary data.

1 = presence of mountains, and
0 = absence of mountains (presence of sediments in other words).

I am wondering that how can I plot it in ArcMap?

4
  • 1
    Try Make XY Event Layer
    – Bera
    Commented Mar 6, 2019 at 17:49
  • after you bring in like @BERA said, then you can plot the mountain flags by category as shown here: desktop.arcgis.com/en/arcmap/10.3/map/working-with-layers/…
    – a11
    Commented Mar 6, 2019 at 18:06
  • 3
    I don't think "sediments" are the opposite of "mountains."
    – csk
    Commented Mar 6, 2019 at 20:03
  • CSK... then may be we can say soil. The data i am working with is about clay, silt, sand and coarse particles. Thank you very much for all the answers. I will try this method in morning and will let you guys know the results.
    – Ahmad
    Commented Mar 7, 2019 at 0:31

1 Answer 1

1

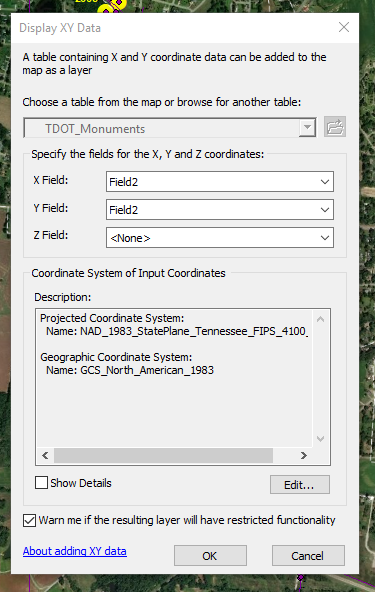
I am going to assume that this data is in a table. If that is the case, in the Table Of Contents, right click the table and choose 'Display XY Data'. This will open a window that will allow you to specify the fields for the X, Y, and Z data.
enter image description here

This will then display the records in the table on the map in the specified coordinate system. (ensure that you choose the correct fields for X and Y and that your coordinate system is correct, or else your features will end up far away from where they really are)

I would leave the Z field as "None" and make that field a status field that you could then use to color code the points as a mountain or not a mountain.

Your Answer

By clicking “Post Your Answer”, you agree to our terms of service and acknowledge you have read our privacy policy.

Not the answer you're looking for? Browse other questions tagged or ask your own question.