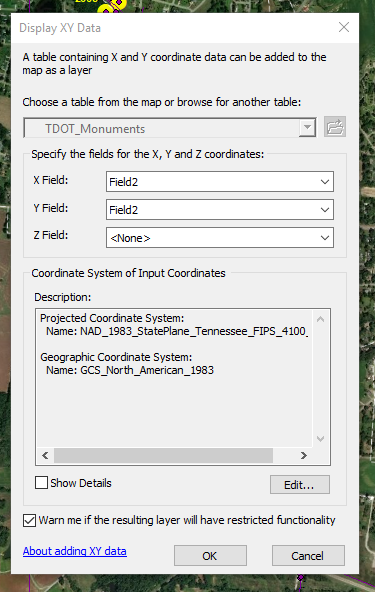
I am going to assume that this data is in a table. If that is the case, in the Table Of Contents, right click the table and choose 'Display XY Data'. This will open a window that will allow you to specify the fields for the X, Y, and Z data.

This will then display the records in the table on the map in the specified coordinate system. (ensure that you choose the correct fields for X and Y and that your coordinate system is correct, or else your features will end up far away from where they really are)
I would leave the Z field as "None" and make that field a status field that you could then use to color code the points as a mountain or not a mountain.

