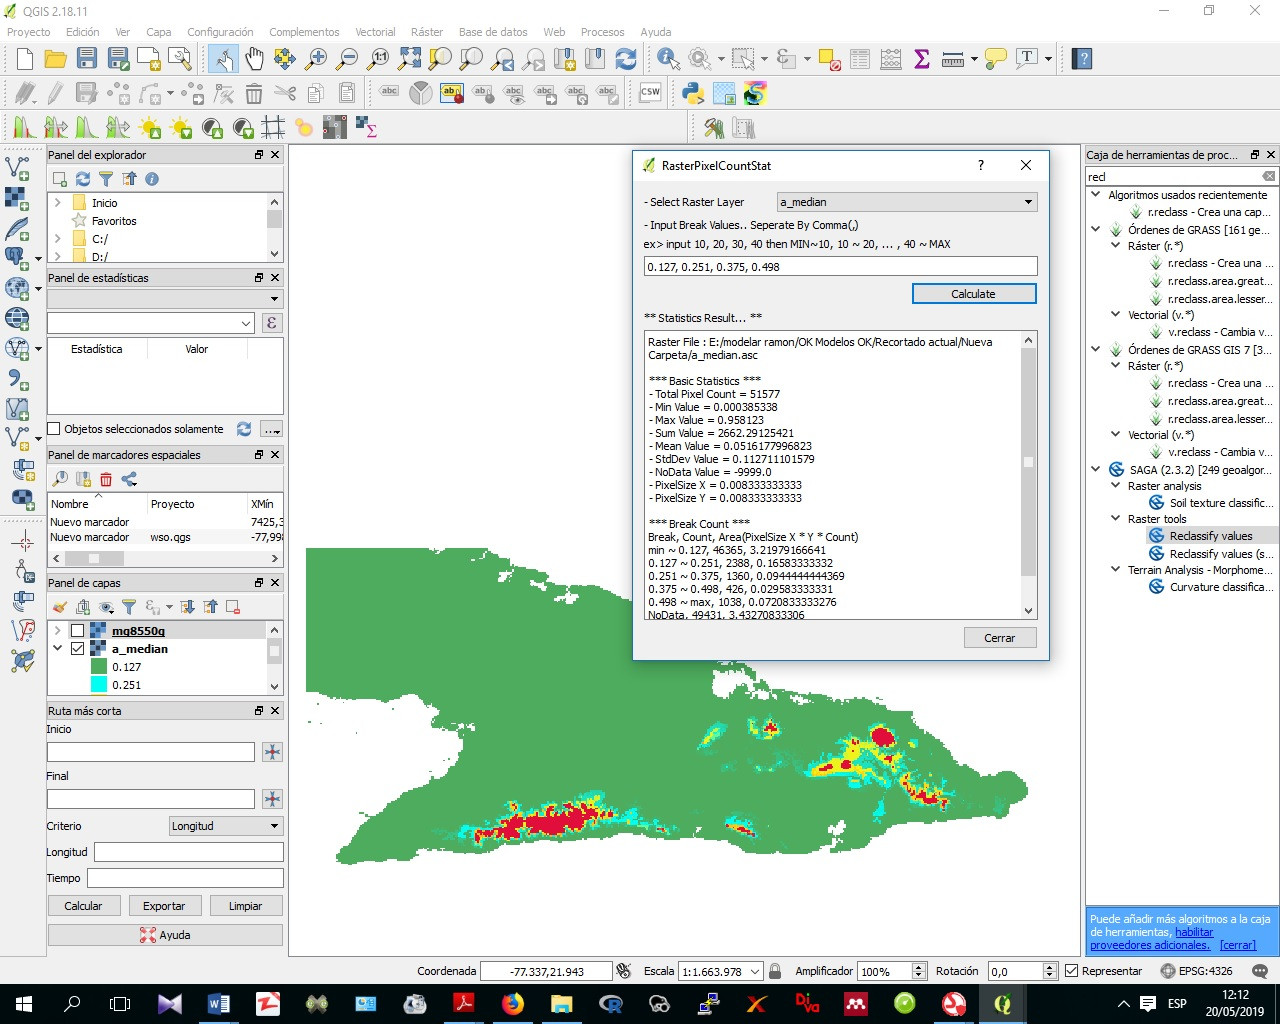
From a raster resolution of 1km² we want to calculate the area that represents each pixel of the same color. The calculation must be done in QGIS.
1 Answer
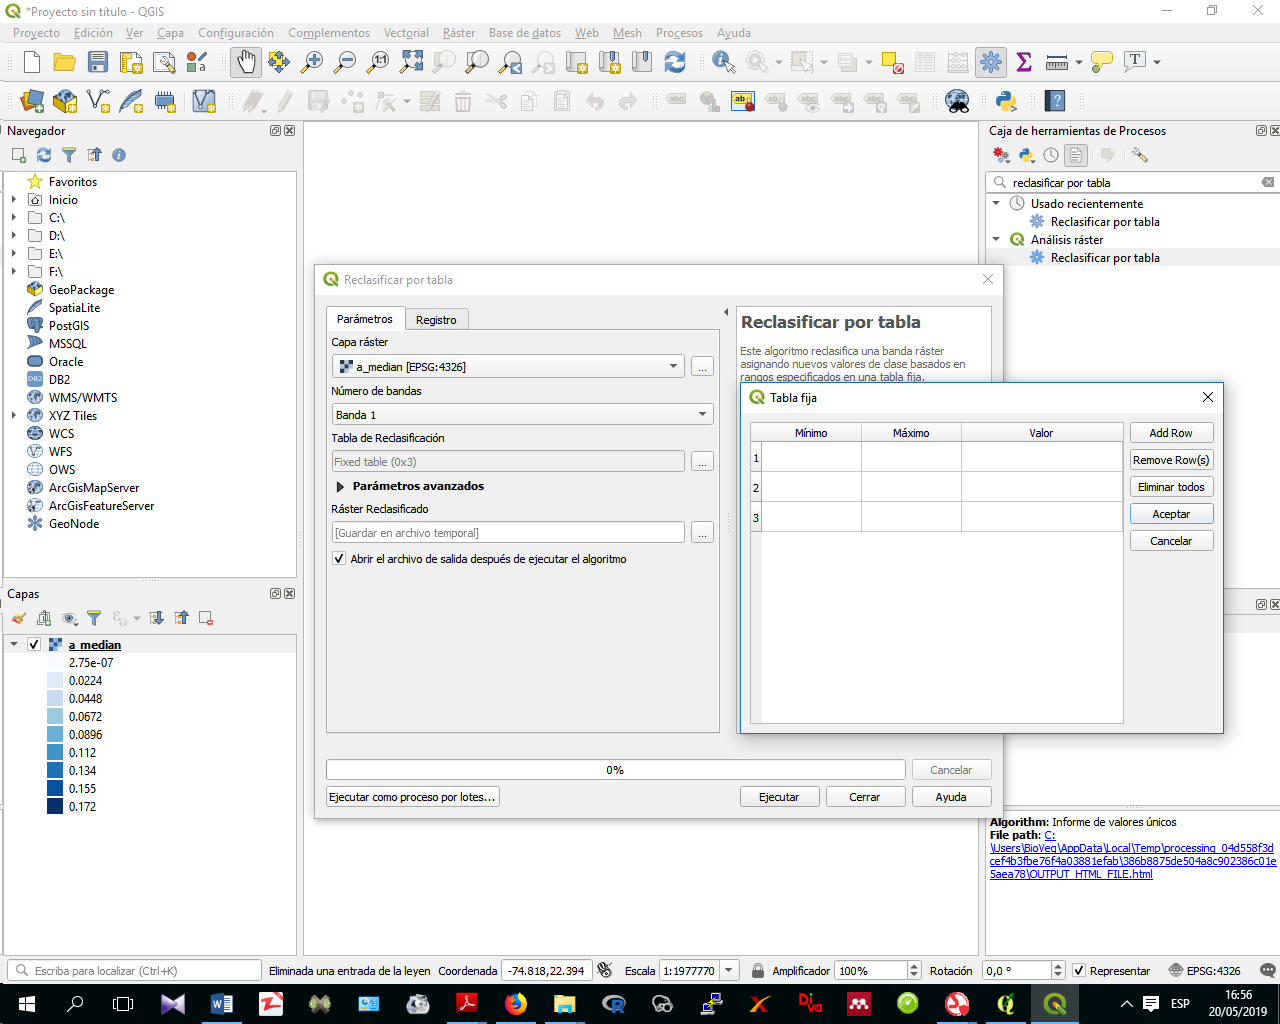
Your screenshot indicates that you're using a continuous raster that is simply being symbolized as discrete classes. Consider running Reclassify by table to cement those classes into the data, converting the different ranges into coded integers.
With a reclassified raster, you can easily run the Raster layer unique values report tool to obtain the information you're looking for:
+-------+-------------+-------------------+
| Value | Pixel count |    Area (ft²)     |
+-------+-------------+-------------------+
|     1 |        1396 |  3454412666071.69 |
|     2 |       14581 |  36080795905437.9 |
|     3 |       26366 | 65242868448170.61 |
|     4 |         505 | 1249626358428.512 |
+-------+-------------+-------------------+
Update: Here is what my reclassification table looked like. Also, I used the Range boundaries type min < value <= max and checked the box for Use no data when no range matches value.
+-----+-----+-------+
| Min | Max | Value |
+-----+-----+-------+
|   1 |   5 |     1 |
|   5 |   8 |     2 |
|   8 |  12 |     3 |
|  12 |  20 |     4 |
+-----+-----+-------+
-
What values are put in the reclassification table? because I get an error when I insert it and I put the maximum and minimum for each color group on the map Commented May 20, 2019 at 19:58
-
-
Parámetros de entrada: { 'DATA_TYPE' : 5, 'INPUT_RASTER' : 'E:/modelar ramon/OK Modelos OK/50 IPSL-CM5A-LR/ip26bi50/Recortada/Modelada/a_median.asc', 'NODATA_FOR_MISSING' : False, 'NO_DATA' : -9999, 'OUTPUT' : 'TEMPORARY_OUTPUT', 'RANGE_BOUNDARIES' : 0, 'RASTER_BAND' : 1, 'TABLE' : [2.756-07,0.250,None,0.251,0.374,None,0.375,0.497,None,0.498,0.955,None] } Valor inválido para el mínimo: 2.756-07 La ejecución falló después de 0.40 segundos Cargando las capas resultantes Algoritmo 'Reclasificar por tabla' finalizado Commented May 20, 2019 at 20:09
-
-


