I have two rasters r1 & r2:
Maximum cell value of r1: 0.9
Maximum cell value of r2: 0.3
Minimum value for both is 0
I am using a color gradient: white - yellow - green - blue - red - black
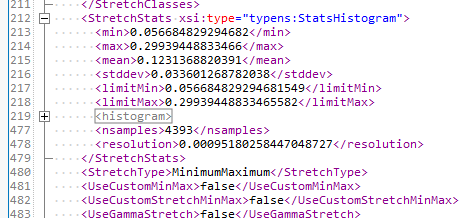
When I apply the symbology of r1 on r2, the max value of r2 (0.3) is black. The symbology is set in relation to the value range of r2.
r1 = arcpy.mapping.Layer("r1.lyr")
mxd = arcpy.mapping.MapDocument("myMap.mxd")
df = arcpy.mapping.ListDataFrames(mxd)[0]
r2 = arcpy.mapping.ListLayers(mxd, "r2.tif", df)[0]
arcpy.ApplySymbologyFromLayer_management(r2, r1)
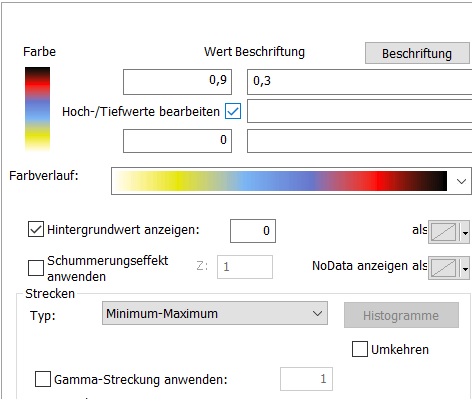
However, I want to compare the two rasters. The values of r2 should therefore be symbolized in relation to the values of r1. The max value of r2 would be yellow in comparison to the value range of r1.
Manually, you can do this in the symbology tab by changing the raster max value by hand:
However, I have a large dataset and I would have to do this a couple of hundred times.
Is there a way to automate this with ArcPy?


