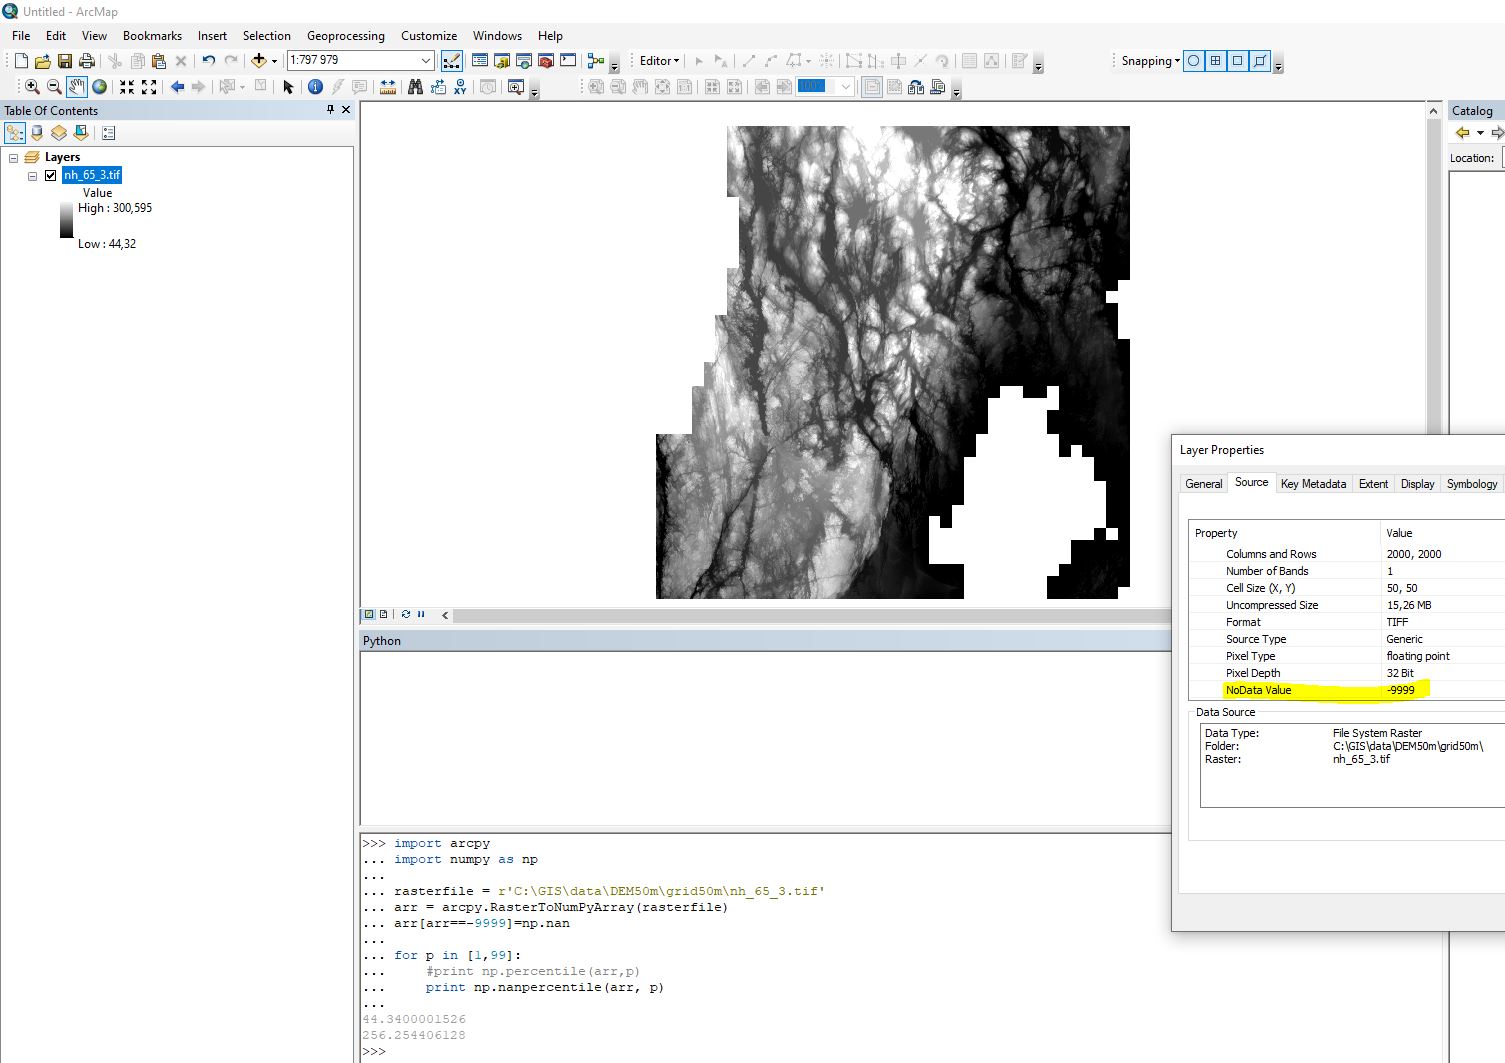
My question is similar to Identifying top 10% of raster cells using ArcGIS Desktop.
I have a Raster layer and want to identify the threshold value for top 1% and bottom 1% of the raster. This is so I can change the symbology to show top 1% as one colour, and Bottom 1% as another.
The raster is a 32bit floating point file with a Max value of 2630.755126953125 and a Min value of -2737.8447265625
I am using ArcMap 10.61 Desktop
I have tried to use the formula indicated in the response below with no success. I tried to test it with the 10% value (0.9) before trying it with 1% (0.99). I end up with a blank raster.
radouxju answered Mar 3 '16 at 6:40
From your comment I understand that you are not looking for percentile but a given percentage of your range. You can use the raster calculator
Con("raster" >= (0.9 * ("raster".maximum - "raster".minimum) + "raster".minimum), 1) of course 0.9 could be replaced by any value (this is an example with 10%). Note that the results will be a raster with 1 or Nodata, but you can also set a value instead of NoData if you need.

