1

I need to resample a raster from nrow= 467, ncol=805, res=0.0416667 degree to nrow=2335, ncol=4025, res=0.00833333 degree. Basically make the pixel size smaller, because I have too many small polygons for raster statistics.

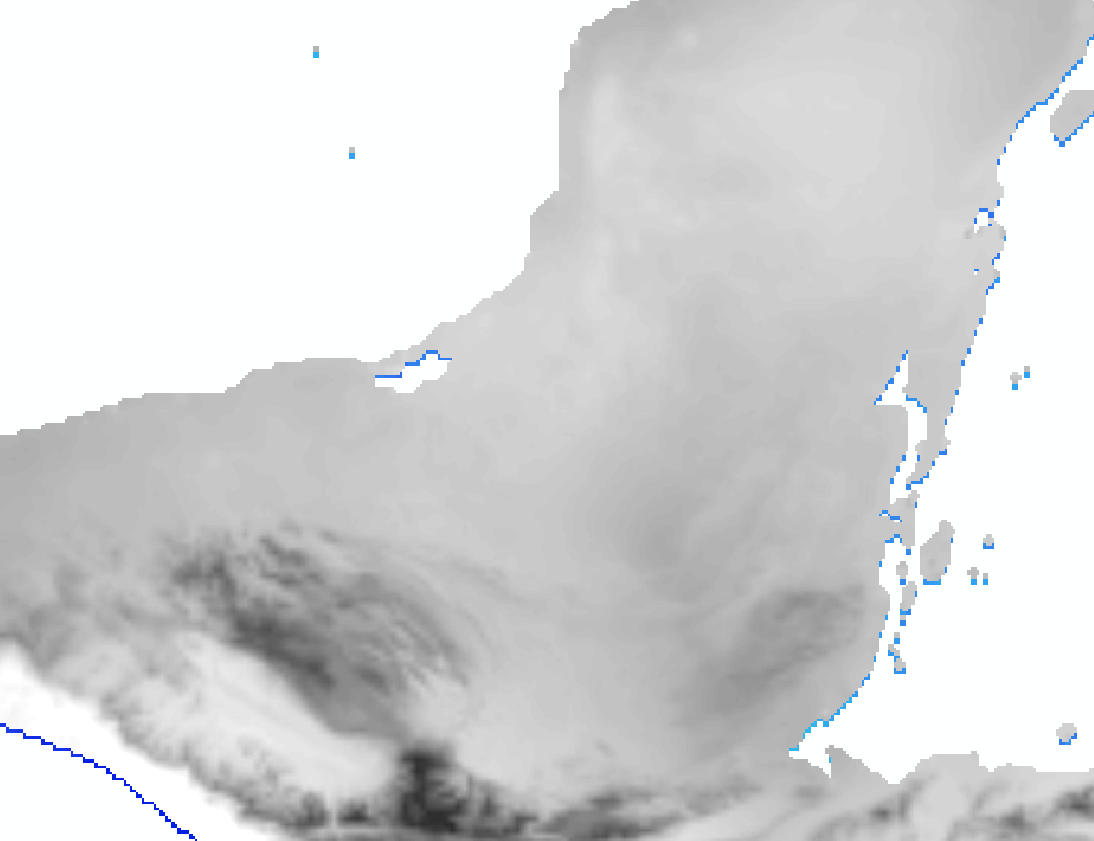
I have tried it with the code below, the problem is that the resulting raster is slightly above the origin raster, see figure.

In gray "test raster", in yellow "original raster".

raster

The new image, raster comparison.

In grey target, in color source

library(raster)
library(sp)
library(rgdal)
library(ggplot2)
library(itertools)

path = '~/path'
spath = '~/path1'

source <- raster(file.path(path,'file.tif'))
>source

Summary of origin raster:
class      : RasterLayer 
dimensions : 467, 805, 375935  (nrow, ncol, ncell)
resolution : 0.04166667, 0.04166667  (x, y)
extent     : -119, -85.45833, 13.54167, 33  (xmin, xmax, ymin, ymax)
crs        : +proj=longlat +datum=WGS84 +no_defs +ellps=WGS84 +towgs84=0,0,0 
source     : ~/path/file.tif 
names      : raster_name 

>summary(source)

        raster_name
Min.            5.516960
1st Qu.         9.151464
Median         10.334464
3rd Qu.        12.149574
Max.           17.560150
NA's            0.000000


# How the raster should be
target <- raster(nrow=2335, ncol=4025, extent(source), crs(source)) 
#origin(target) <- c(-119, 32.9583) # Commented for further 'experiments'
>target

class      : RasterLayer 
dimensions : 2335, 4025, 9398375  (nrow, ncol, ncell)
resolution : 0.008333333, 0.008333333  (x, y)
extent     : -119, -85.45833, 13.54163, 32.99997  (xmin, xmax, ymin, ymax)
crs        : +proj=longlat +datum=WGS84 +no_defs +ellps=WGS84 +towgs84=0,0,0 

> summary(target)
        layer
Min.       NA
1st Qu.    NA
Median     NA
3rd Qu.    NA
Max.       NA
NA's       NA


# Project source raster to target raster by bilinear
dest <- projectRaster(source, target, method='bilinear', tolerance=0.0001)
>dest

class      : RasterLayer 
dimensions : 2335, 4025, 9398375  (nrow, ncol, ncell)
resolution : 0.008333333, 0.008333333  (x, y)
extent     : -119, -85.45833, 13.54163, 32.99997  (xmin, xmax, ymin, ymax)
crs        : +proj=longlat +datum=WGS84 +no_defs +ellps=WGS84 +towgs84=0,0,0 
source     : memory
names      : raster_name
values     : 5.517167, 17.58864  (min, max)

> summary(dest)
        raster_name
Min.        5.517167e+00
1st Qu.     9.154074e+00
Median      1.034819e+01
3rd Qu.     1.217350e+01
Max.        1.758864e+01
NA's        5.232403e+06


# Write new raster file to a path
writeRaster(flip(dest, direction='y'), file.path(spath, 'target.tif'))```


6
  • What's with the "flip"? What is the extent and summary of your original raster? Why do you change the origin of r from the origin of test which it gets via extent(test)? In your image, which is "the original raster"? The one read from file.tif and called test? What's the purple?
    – Spacedman
    Commented May 31, 2019 at 15:59
  • The flip is because when I load the raster in R, is "flipped" like a mirror (up-side-down). Honestly, I do not know why this happens, but if saving it without the flip, the raster is badly stored. I have tried to set the origin via extent(test) but the problem remains, the resulting raster is a little bit up from the original. The original raster is file.tif = test. The purple is a polygon underneath, I did not turn off the shapefile.
    – Daniel
    Commented May 31, 2019 at 16:03
  • This isn't much clearer. Load the source raster from file.tif into a thing called source and show summary(source). Then set up the raster with the target resolution and extent and call it target and show summary(target). Then do the reproject into something called dest and show summary(dest). Everything else is clutter.
    – Spacedman
    Commented May 31, 2019 at 16:49
  • Sorry, I am not an expert in R. Is it clearer now? I have renamed the variables.
    – Daniel
    Commented May 31, 2019 at 17:41
  • You've still got a origin set in there. You can't do that. It will shift your rasters. If you have two rasters where extent(a) == extent(b) and they still don't line up on the plot, let me know.
    – Spacedman
    Commented Jun 11, 2019 at 15:22

1 Answer 1

1

Here's code that follows what you are doing.

First make a raster like your source:

source = raster(nrow = 467, ncol = 805, 
     xmn=-119, xmx=-85.45833, ymn=13.54167, ymx=33)
crs(source) = "+proj=longlat +datum=WGS84 +no_defs +ellps=WGS84 +towgs84=0,0,0"

Fill it with zeroes plus a diagonal line of 99s so we can test alignments:

source[] = 0
source[seq(1,ncell(source),by=806)] = 99
plot(source)

Now the target and the projection to the destination:

target <- raster(nrow=2335, ncol=4025, extent(source), crs(source)) 
dest <- projectRaster(source, target, method='bilinear', tolerance=0.0001)

Sanity check:

> extent(dest) == extent(source)
[1] TRUE

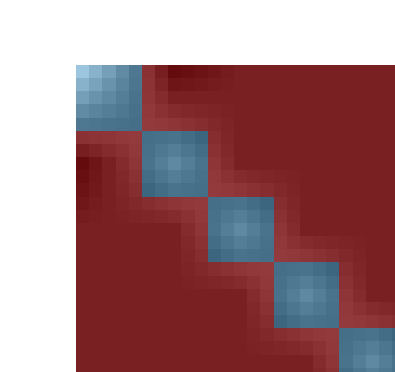
Now its hard to visualise two rasters on top of each other in R so I exported them to QGIS and coloured and overlaid them. Look at this image extreme-zoomed in to the raster in order to show what is going on at the pixel level:

enter image description here

The blue/red is showing five pixels from the source raster - you can see the pixel edges. The fuzzy shading is a transparent overlay of the dest raster. Note how the bilinear filtering is smearing out each pixel into a rough square of pixels, and that they align perfectly with the centre of each source pixel. There are no alignment problems.

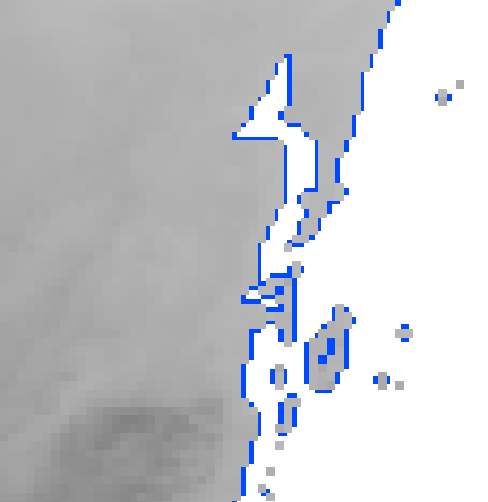
If I do this with your data and then overlay them (suitably Y-flipped) there's no systematic shift showing up as a colour fringe on one side, but there is a slight expansion of the land caused by the smoothing filter, which shows equally on all sides. I've coloured the underlying raster pure blue so it looks even worse than it would if the underlying raster was gray-shaded. This looks totally as expected:

enter image description here

Here's the exact code that produced those rasters:

source=raster("./January6690_mean.tif")
target <- raster(nrow=2335, ncol=4025, extent(source), crs(source)) 
dest <- projectRaster(source, target, method='bilinear', tolerance=0.0001)
writeRaster(flip(dest, direction='y'), "flipdest.tif")
writeRaster(flip(source, direction='y'), "flipsource.tif")
7
  • Spacedman, it is much clear now with your detailed answer. However, when I do the resample for the desired resolution only considering dest3 <- resample(nrow=2335, ncol=4025, ext=extent(source)) my new raster is still not overlapping. How can I solve this?
    – Daniel
    Commented Jun 11, 2019 at 12:23
  • That's not valid code - resample takes two rasters and no ext argument - please try and make examples using code that runs. Edit your question. Show the outputs of printing your rasters so we can see the extents, dimensions, and resolutions.
    – Spacedman
    Commented Jun 11, 2019 at 13:14
  • You are right, it was dest3 <- raster(nrow=2335, ncol=4025, ext=extent(source)). With target2 <- resample(source, dest3, method='bilinear'). However, once more, the resulting raster target2 it is one pixel/cell above as shown in the picture. Look, I have even tried with another raster and another resolution and the same is happening. I do not get this mistake if I do the process with ArcMap. However, I want to it with R.
    – Daniel
    Commented Jun 11, 2019 at 14:29
  • I can't reproduce your error: source = raster(matrix(1:12,3,4)) ; dest3 = raster(nrow=2335, ncol=4025, ext=extent(source)) ; target2 <- resample(source, dest3, method='bilinear') and then extent(target2) == extent(source) is TRUE
    – Spacedman
    Commented Jun 11, 2019 at 14:47
  • Have you plotted them together? Because I am getting TRUE, but the image is completely different. See it in the post.
    – Daniel
    Commented Jun 11, 2019 at 15:10

Your Answer

By clicking “Post Your Answer”, you agree to our terms of service and acknowledge you have read our privacy policy.

Not the answer you're looking for? Browse other questions tagged or ask your own question.