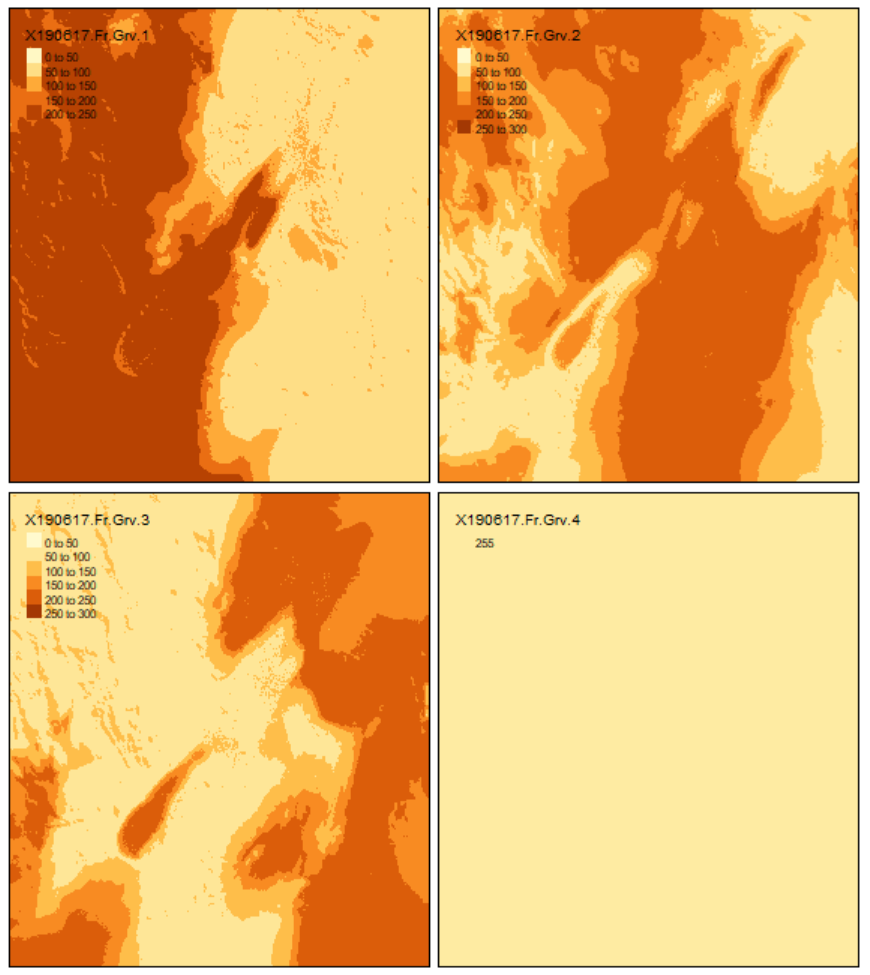
I've exported a raster object from QGIS into GeoTIFF format and imported it into R as a raster brick using the brick() function from the raster package. The file is too large to share but it imports OK and appears to have four layers, which I interpret to be R, G, B and alpha
class      : RasterBrick
dimensions : 4895, 4333, 21210035, 4  (nrow, ncol, ncell, nlayers)
resolution : 100, 100  (x, y)
extent     : 357310.5, 790610.5, 6299190, 6788690  (xmin, xmax, ymin, ymax)
crs        : +proj=utm +zone=51 +south +ellps=GRS80 +towgs84=0,0,0,0,0,0,0 +units=m +no_defs
source     : C:/_Work/_Research/xxxx/QGIS/190617.Fr.Grv.tif
names      : X190617.Fr.Grv.1, X190617.Fr.Grv.2, X190617.Fr.Grv.3, X190617.Fr.Grv.4
min values :                0,                0,                0,                0
max values :              255,              255,              255,              255
The image plots OK and quickly using the plotRGB() function from raster but the automatic grid is pretty rubbish so I was looking for a nicer plotting package. I've installed the tmap R package and used the following in an attempt to plot my 'Brick'
tmap_options(max.raster = c(plot = 21210035, view = 21210035))
tm_shape(Brick) + tm_raster()
This command works OK (takes several minutes) to process and produces a 4x4 layout of the four bands in the brick in a nominal scale (0-300), with band 4 being all 255 (I expect the value should be 1 for alpha?)
Next, I try
tm_shape(Brick) + tm_rgb()
But this results in an error as follows.
Error in x[, 4] : subscript out of bounds
Which is probably related to the band four being all 255. Is there an option or workaround to solve this problem as I quite like the look for tmap() for plotting image data.

