4

I have two classified landsat images from 2014 and 2018 both of them containing 6 classes including urban,forest,barren etc. In order to see how each pixel's class changed or remained same from earlier image i computed cross table taking both images like this :

contingencyTable <- raster::crosstab(landscape_2014, landscape_2018, long = TRUE)

This gave me the number of pixels in both images for each class but this has no latitude or longitude so this is where my question arises. How can i convert this dataframe/table into a raster so that i am able to visualize that a specific area changed from forest to urban and so on?

I know how to convert dataframe to a raster using rasterFromXYZ(df) but that requires lat,long which is not there in the table. The table looks something like this:

crosstab(r1,r2)
[r1]  [r2]  Count
0     0     3456
1     41    23456
0     41    768
1     42    21
0     42    6

I am following Creating Land Cover Change Classification in R? for detecting land cover change

** R Code **

library(raster)
f2014<- raster("landsat_2014.tif")
f2018<- raster("landsat_2018.tif")
output <- overlay(f2014,
                      f2018,
                      fun=function(r1, r2){return(r1-r2)})
plot(output)
5
  • 1
    crosstab output is an error matrix, it has no spatial attributes. What you need is a more sophisticated analysis. Since you aren't posting data or code values, I can't elaborate an accurate answer for your needs. You can use logical functions for meeting your needs
    – aldo_tapia
    Commented Jul 23, 2019 at 12:52
  • @aldo_tapia ah ok! so if i subtract both the images (r2-r1) and then plot the output using plot() that should give me the change for each pixel. right ?
    – rehan
    Commented Jul 23, 2019 at 12:58
  • Not exactly. I'll upload some code showing how to do it
    – aldo_tapia
    Commented Jul 23, 2019 at 13:05
  • @aldo_tapia i have added the code. that's how i would do it. and then i guess reclassify the output according to the change in classes by visualizing histograms?
    – rehan
    Commented Jul 23, 2019 at 13:18
  • 1
    I have a function "raster.change" in the development version of spatialEco that implements several methods (kappa, t.test, correlation, delta entropy, cross-entropy and Kullback-Leibler divergence) for evaluating change between two rasters. It does rely on the specification of a spatial window and is not a single pixel-to-pixel match. github.com/jeffreyevans/spatialEco Commented Jul 23, 2019 at 16:50

2 Answers 2

6

Suppose two LULC rasters with 6 classes each one:

library(raster)
library(rasterVis)

r <- raster()

set.seed(123)

lc1 <- setValues(r, sample(1:6, 64800, replace = T))
lc2 <- setValues(r, sample(1:6, 64800, replace = T))

To detect landcover changes, the basic approach is to using logical tests:

changeDet1 <- lc1 != lc2

The result is 1 when values are not the same (change) and 0 when are the same (remain). So for this case, both raster needs to be codified in the same way.

For other kinds of questions like 'change from class 1 to class 2', the procedure is the same:

changeDet2 <- (lc1 == 1) & (lc2 == 2)

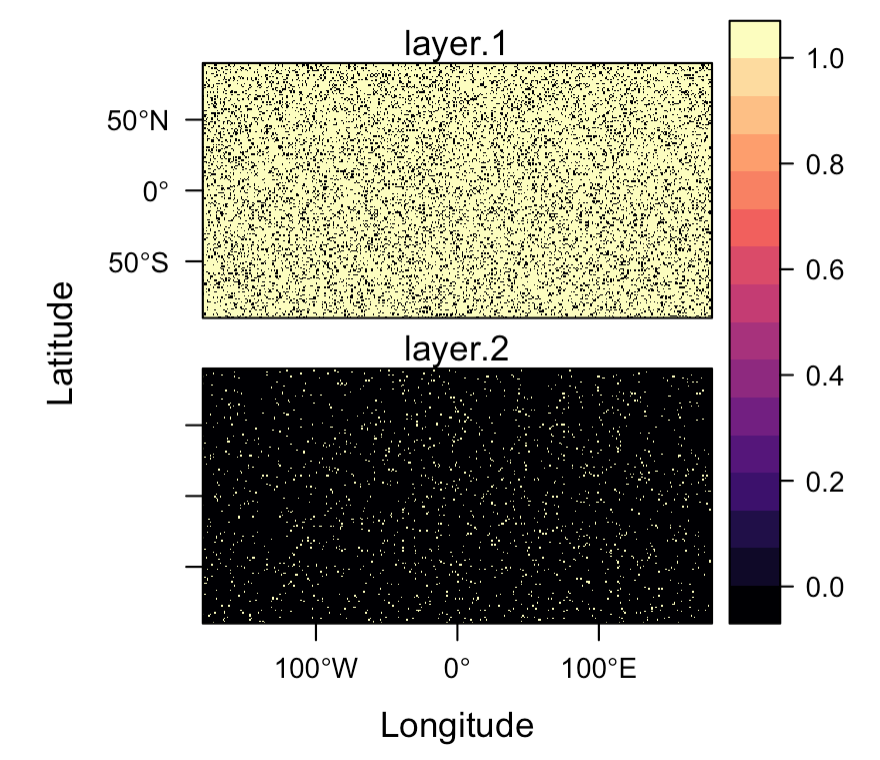
As you know, logical tests are 1 when is true and 0 when is false:

levelplot(stack(changeDet1, changeDet2))

enter image description here


As I said, this is the basic approach, a little bit more sophisticated:

The same first test inside a function:

change <- function(x){
  if(x[1] != x[2]){
    val = 1
  }else{
    val = 0
  }
  val
}

changeDet1 <- calc(stack(lc1,lc2), fun = change)

Result will be the same one. But if you need to know which class had changed, from which class to which class the change was made, and so on, you need to create a dictionary:

Identify classes, add a code value and test if the code value is a class change or class remain:

lc1_uniq <- unique(lc1)
lc2_uniq <- unique(lc2)
grid_ <- expand.grid(lc1_uniq,lc2_uniq)
names(grid_) <- c('from','to')
grid_$code <- 1:dim(grid_)[1]
grid_$change <- grid_[,1] != grid_[,2]

head(grid_)

#  from to code change
#1    1  1    1  FALSE
#2    2  1    2   TRUE
#3    3  1    3   TRUE
#4    4  1    4   TRUE
#5    5  1    5   TRUE
#6    6  1    6   TRUE

Then, create a function to apply dictionary code values:

change <- function(x){
  grid_[x[1] == grid_[,1] & x[2] == grid_[,2],'code']
}

And finally, apply the function:

changeDet1 <- calc(stack(lc1,lc2), fun = change)

Check results:

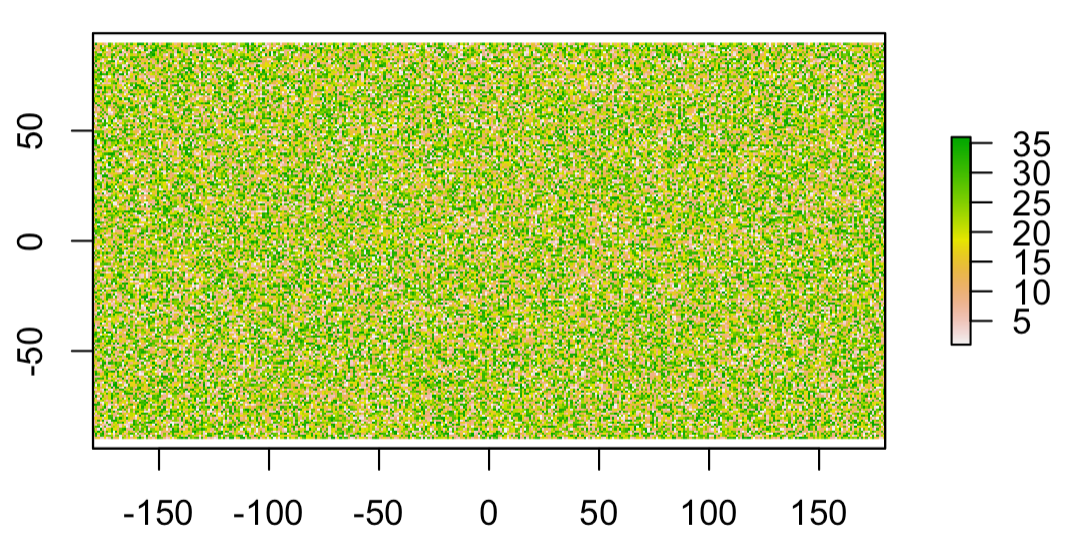
plot(changeDet1)

enter image description here

In this case, for a pixel's value of 6 means that the original class was 6 and now is 1.


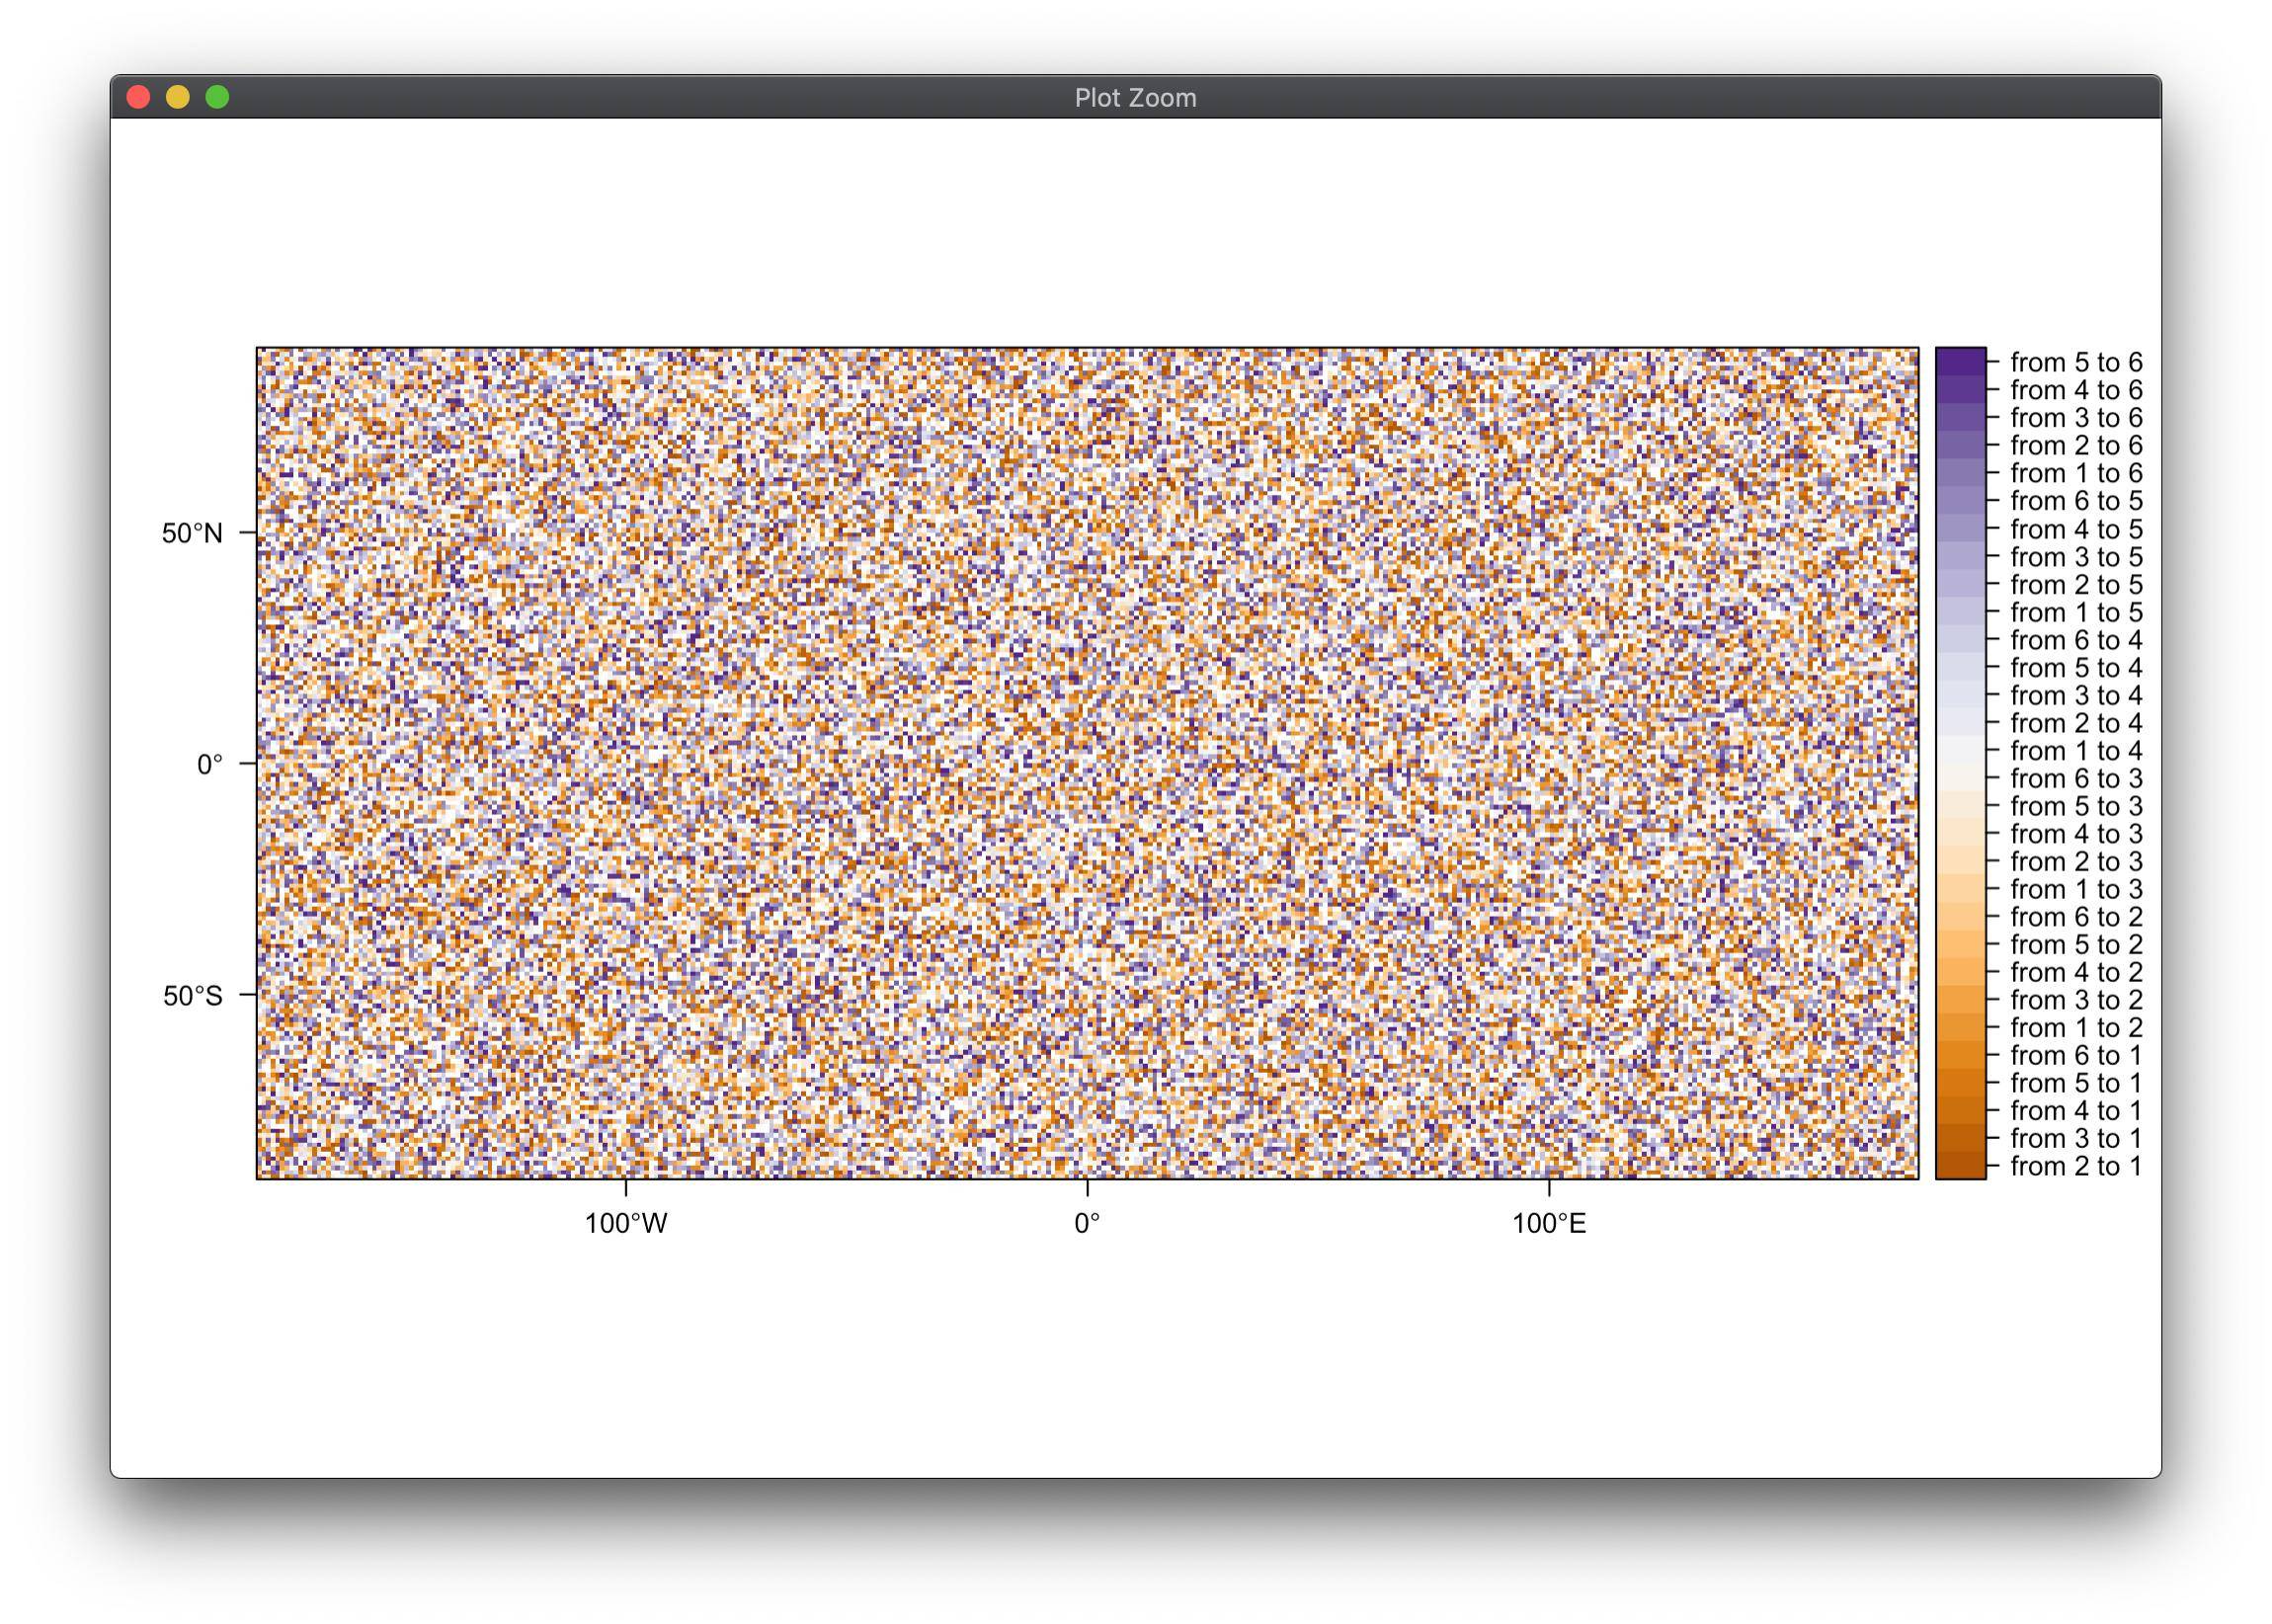
Class representation (only change detection)

# Create legend labels
codes_ <- data.frame(ID = grid_$code,value = paste0('from ',grid_[,1],' to ',grid_[,2]))
logical_test <- which(grid_$change == T) # remove no change classes
codes_ <- codes_[logical_test,]
# Create a Raster Attribute Table
rat <- levels(changeDet1)[[1]]
rat[["Changes"]] <- codes_
levels(changeDet1) <- rat
# Plot
levelplot(changeDet1, par.settings=PuOrTheme(), xlab="", ylab="")

enter image description here

9
  • this means that i'll have to create both above mentioned tests for all the possible class combinations and then stack all the outputs? Also what's wrong with my code?
    – rehan
    Commented Jul 23, 2019 at 13:38
  • The first part of your code is the creation of a contingency table; the second part, is a subtraction between both rasters. Let me update my code
    – aldo_tapia
    Commented Jul 23, 2019 at 13:41
  • sure, waiting. Also if i print out the table as you have described in the linked question. does it gives me the occurence of classes in both images. is the table showing me the LC changes by any way? if you elaborate it's values a little bit
    – rehan
    Commented Jul 23, 2019 at 13:56
  • Yes, for sure. Is the use of that kind of tables. Shows you the occurrence of classes on both images and how they changed in time. Now I edited my answer to meet your needs
    – aldo_tapia
    Commented Jul 23, 2019 at 13:59
  • 1
    @Rehan it depends of codes_ data.frame. Just keep the ID related to desired classes and add the custom label to values column
    – aldo_tapia
    Commented Aug 5, 2019 at 0:12
5

Using sample data from @aldo_tapia :

library(raster)
library(rasterVis)

r <- raster()

set.seed(123)

lc1 <- setValues(r, sample(1:6, 64800, replace = T))
lc2 <- setValues(r, sample(1:6, 64800, replace = T))

This function returns a binary 0/1 raster if r1 is i and r2 is j:

changefrom=function(r1,r2,i,j){r1==i & r2==j}

lets loop this over your 6 classes for i and j and get a nested list of rasters:

s = lapply(1:6, function(i){lapply(1:6, function(j){changefrom(lc1, lc2, i,j)})})

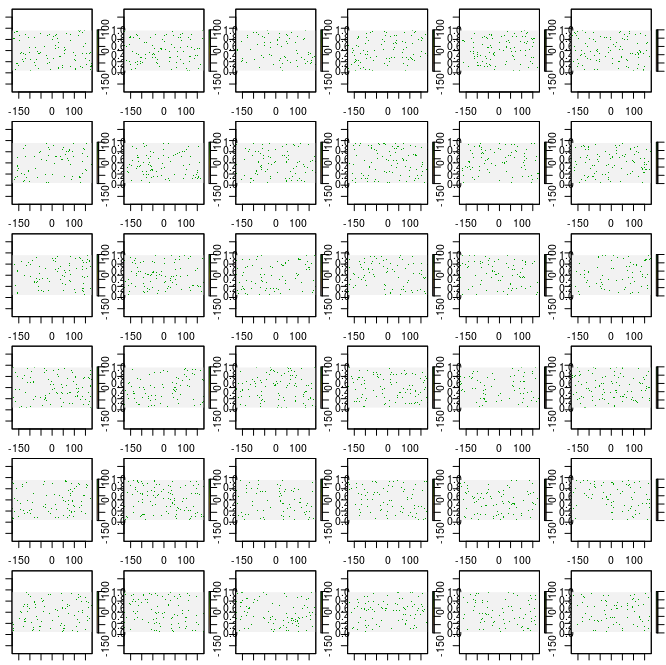
We can then plot this in a 6x6 grid:

par(mfrow=c(6,6)); for(i in 1:6){for(j in 1:6){plot(s[[i]][[j]])}}

enter image description here

in that plot, the second row down, third plot across is a plot of the pixels that have changed from class 2 to class 3 (if I've got my i and j the right way. Please check with something that's easier to test).

That plot can be made neater with some adjustments to margins etc. Or you can flatten it to a raster stack but then you lose the 6x6 structure.

I suspect a function for doing all this might be in a package somewhere.

2
  • my actual data is much bigger than this classwise and in number of images so i am not sure of taking this route
    – rehan
    Commented Jul 23, 2019 at 13:40
  • Okay, then apply the changefrom function over the classes you are interested.
    – Spacedman
    Commented Jul 24, 2019 at 9:10

Your Answer

By clicking “Post Your Answer”, you agree to our terms of service and acknowledge you have read our privacy policy.

Not the answer you're looking for? Browse other questions tagged or ask your own question.