I am by no means an expert in ArcGis, but I will try and explain my problem as clearly as possible.
I am analysing forest cover data from the Hansen land-cover dataset ( data https://earthenginepartners.appspot.com/science-2013-global-forest/download_v1.2.html) to estimate the proportion of forest cover around multiple lake surface samples taken from the same lake.
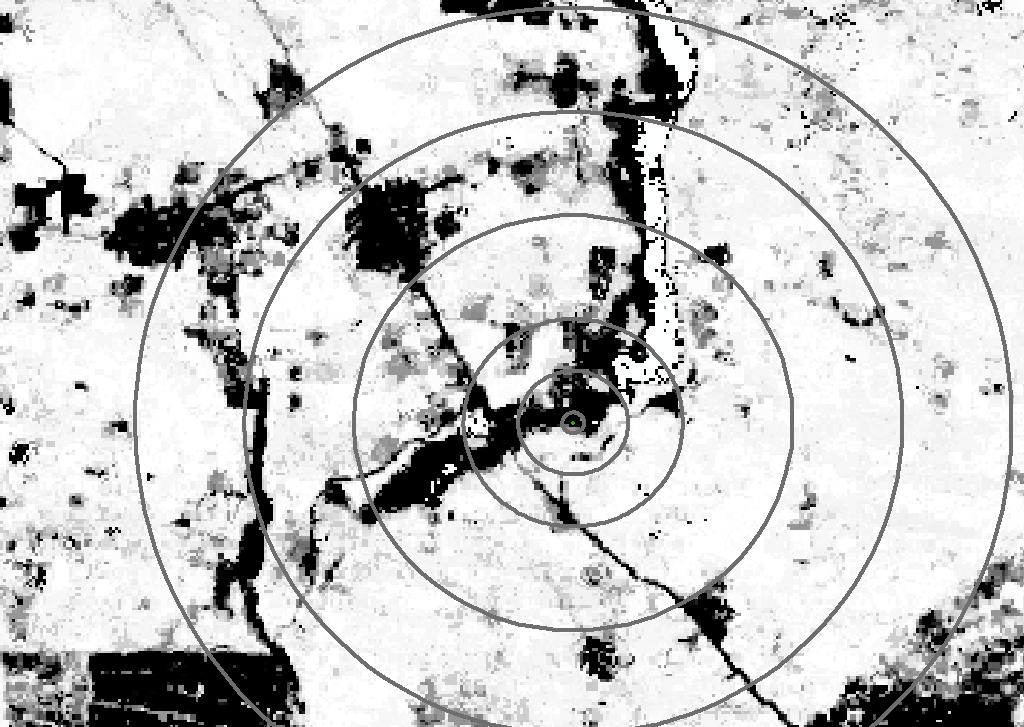
 To treat this dataset I needed to mask the water component. This is because the water and the not forest (signified by the black in the map below, with the forest white)were both given the value of 1. Therefore, when originally extracting my data, a not forest value of 20% could have signified that 10% of the data in an individual buffer was represented by water, rather than the targeted not-forest.Image of my map below with the buffers for one data point
I created a series of buffers, using the multiple buffer tool, around each one of my lake surface samples ( 0.1, 0.5, 1-10 km).
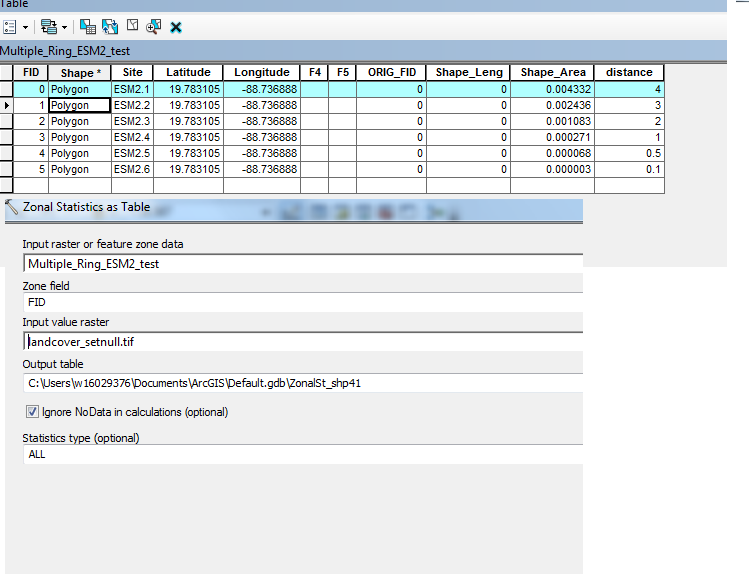
To determine the stats for the forest/not forest in each one of these buffers I used the zonal statistics as table tool. This produced a table for my data but only with the statistics from one of the buffer zones.
For using the zonal statistics, I used the multiple buffer shapefile output and the masked landcover map as my raster.
Since I have 15 lake surface samples, I could do each one of the buffer zones independently and extract the data using the statistics tool but this is extremely time-consuming. I notice that when I am selecting the Zone field option, I select the FID option because it is the only option to select that has different values for each individual buffer (Latitude/Longitude and Site name are equal). See below for the options selected
As mentioned, I gave this a test run before I went about to mask the water data and it produced the zonal statistics in the way in which I wanted them. i.e in one table, I would have the zonal statistics for each of my buffers rather than the current situation where I am only getting one statistic for all the buffers.

