I have a code that classifies polygons based on their NDVI values (based on mean and std, classes into 3 ranges: high, medium and low).
The code suppose to do this process for each polygon, but I hace found that it calculates it for each polygon only if I draw the polygons manually, otherwise, if I use an uploaded shapefile it calculates the statistics for all the polygons and not only for one.
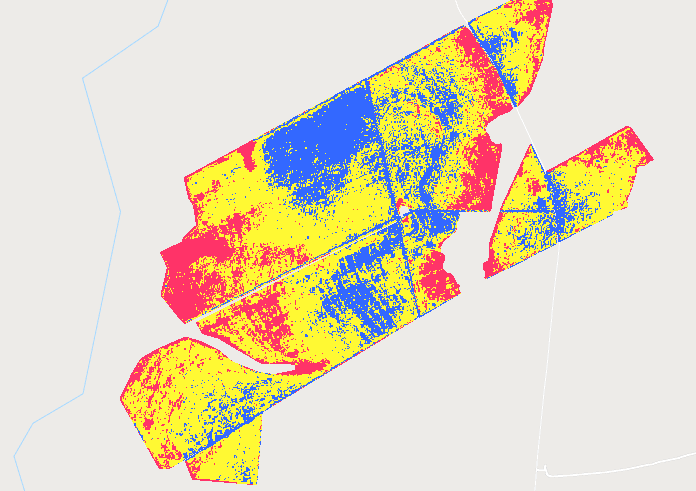
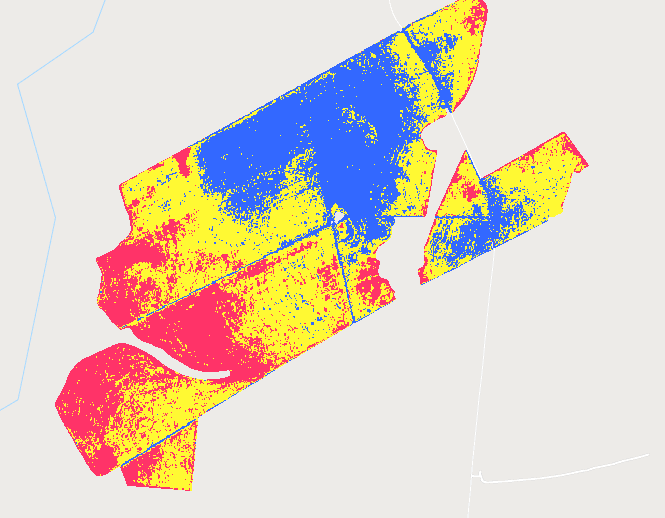
Here is an example:
This is when I draw the polygons manually:
and this is when I use my uploaded shapefile:
So as you can see, it seems like when I use my shapefile which is a FeatureCollection, it doesn't work.
I have tried to change my FeatureCollection to polygon. using at the beginning:
var geometry=mytable.geometry()
But I still got the same results
This is my code:
Map.centerObject(geometry,13);

var ndviClassImg = geometry instanceof ee.Geometry.MultiPolygon
  ? ee.ImageCollection(
      geometry.coordinates().map(function (coordinates) {
        return getNdviClassImg(ee.Geometry.Polygon(coordinates));
      })
    ).mosaic()
  : getNdviClassImg(geometry);

Map.addLayer(ndviClassImg, {palette: ['FFF933', '3368FF', 'FF3368'], min: 1, max: 3},'mosaic');

function getNdviClassImg(geometry) {
  /**
   * Function to mask clouds using the Sentinel-2 QA band
   * @param {ee.Image} image Sentinel-2 image
   * @return {ee.Image} cloud masked Sentinel-2 image
   */
  function maskS2clouds(image) {
    var qa = image.select('QA60');

    // Bits 10 and 11 are clouds and cirrus, respectively.
    var cloudBitMask = 1 << 10;
    var cirrusBitMask = 1 << 11;

    // Both flags should be set to zero, indicating clear conditions.
    var mask = qa.bitwiseAnd(cloudBitMask).eq(0)
        .and(qa.bitwiseAnd(cirrusBitMask).eq(0));

    return image.updateMask(mask).divide(10000)
    .copyProperties(image, ['system:time_start']);
  }

  // Map the function over one year of data and take the median.
  // Load Sentinel-2 TOA reflectance data.
  var dataset = ee.ImageCollection('COPERNICUS/S2')
                    .filterDate('2019-06-25','2019-07-06')
                    // Pre-filter to get less cloudy granules.
                    .filter(ee.Filter.lt('CLOUDY_PIXEL_PERCENTAGE', 100))
                    .select('B1','B2','B3','B4','B8','QA60')
                    .filterBounds(geometry)
                    .map(maskS2clouds);


  //var count=dataset.size();
  //print('number of images in dataset:',count);

  var clippedCol=dataset.map(function(im){
    return im.clip(geometry);
  });

  //function to calculate NDVI
  var addNDVI = function(image) {
    var ndvi = image.normalizedDifference(['B8', 'B4'])
    .rename('NDVI')
    .copyProperties(image,['system:time_start']);
    return image.addBands(ndvi);

  };

  //NDVI to the clipped image collection
  var withNDVI = clippedCol.map(addNDVI).select('NDVI');


  var listOfImages =(withNDVI.toList(withNDVI.size()));
  var MyImage=ee.Image(withNDVI.first());

  var tableWithStats = MyImage.reduceRegion({
    geometry: geometry,
    reducer: ee.Reducer.mean().combine({
    reducer2: ee.Reducer.stdDev(),
    sharedInputs: true
    }),
    scale: 20
  });


  //calculation
  var std2 = ee.Number(tableWithStats.get('NDVI_stdDev')).divide(4);
  var mean1 = ee.Number(tableWithStats.get("NDVI_mean"));

  // the classes borders
  var negBorder=mean1.subtract(std2);
  var posBorder=mean1.add(std2);

  //create the layers
  var imageNDVI=MyImage.select('NDVI');
  var gtPOS=MyImage.gt(posBorder).selfMask().rename('range');
  var ltNEG=MyImage.lt(negBorder).selfMask().rename('range');
  var betMEAN=MyImage.gt(negBorder).and(imageNDVI.lt(posBorder)).selfMask().rename('range');

  return ee.Image([betMEAN, ltNEG, gtPOS])
    .selfMask()  // Mask 0's
    .multiply(ee.Image([1, 2, 3])) // Assign values to the classes
    .reduce(ee.Reducer.firstNonNull()); // Pick first class
}

var visulaiztion={palette: ['00ff00', 'ff0000', '006622'], min: 1, max: 3};
//var toexport=ndviClassImg.visualize(visulaiztion).addBands(ndviClassImg);

Export.image.toDrive({
    image: ndviClassImg.toFloat(),
    description:'mosaic',
    scale: 20,
    crs: 'EPSG:4326',
    region: geometry,
  });
Unfortunately, I can't share the geometry, but it is supposed to be the same if you use any layer with a few polygons that you have uploaded and then draw it manually.
EDIT: Please find the code here:
https://code.earthengine.google.com/ed26e656db7ba2ffe8fdf02f3831f98c
I have uploaded two geometries: one shapefile and one manually drawn, you can see the differences


