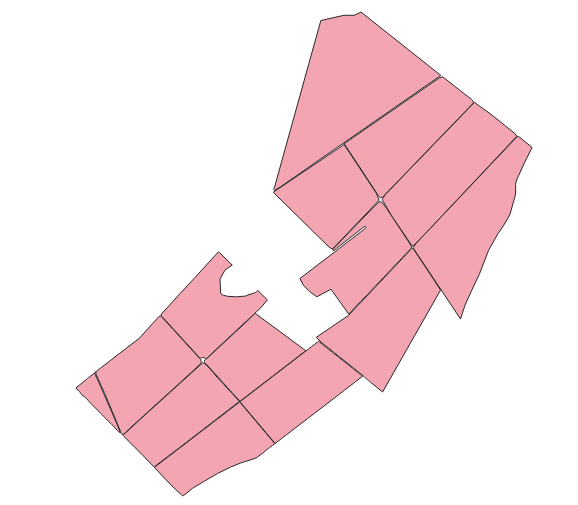
I have one shapefile of agriculture plots that looks like this-
I want to run analysis in google earth engine but for each plot.
Is there any way to run this analysis without saving each plot and upload it as table?
Can google earth engine run my analysis for each plot separately while they are all in one shapefile?
this is my code-
var geometry=table;//this is the featurecollection

/**
 * Function to mask clouds using the Sentinel-2 QA band
 * @param {ee.Image} image Sentinel-2 image
 * @return {ee.Image} cloud masked Sentinel-2 image
 */
function maskS2clouds(image) {
  var qa = image.select('QA60');

  // Bits 10 and 11 are clouds and cirrus, respectively.
  var cloudBitMask = 1 << 10;
  var cirrusBitMask = 1 << 11;

  // Both flags should be set to zero, indicating clear conditions.
  var mask = qa.bitwiseAnd(cloudBitMask).eq(0)
      .and(qa.bitwiseAnd(cirrusBitMask).eq(0));

  return image.updateMask(mask).divide(10000)
  .copyProperties(image, ['system:time_start']);
}

// Map the function over one year of data and take the median.
// Load Sentinel-2 TOA reflectance data.
var dataset = ee.ImageCollection('COPERNICUS/S2')
                  .filterDate('2019-06-01', '2019-06-30')
                  // Pre-filter to get less cloudy granules.
                  .filter(ee.Filter.lt('CLOUDY_PIXEL_PERCENTAGE', 20))
                  .select('B1','B2','B3','B4','B8','QA60')
                  .filterBounds(geometry)
                  .map(maskS2clouds);

var rgbVis = {
  min: 0.0,
  max: 0.3,
  bands: ['B4', 'B3', 'B2'],
};

var clippedCol=dataset.map(function(im){
   return im.clip(geometry);
});


//test if clipping the image collection worked
Map.centerObject(geometry,9);
Map.addLayer(clippedCol.median(), rgbVis, 'RGB');

//function to calculate NDVI
var addNDVI = function(image) {
  var ndvi = image.normalizedDifference(['B8', 'B4'])
  .rename('NDVI')
  .copyProperties(image,['system:time_start']);
  return image.addBands(ndvi);

};

//NDVI to the clipped image collection
var withNDVI = clippedCol.map(addNDVI).select('NDVI');


var colorizedVis = {
  min: 0.0,
  max: 1.0,
  palette: [
    'FFFFFF', 'CE7E45', 'DF923D', 'F1B555', 'FCD163', '99B718', '74A901',
    '66A000', '529400', '3E8601', '207401', '056201', '004C00', '023B01',
    '012E01', '011D01', '011301'
  ],
};


//analyze images from image collection collection
var listOfImages = withNDVI.toList(withNDVI.size());
var listOfNumbers =[0,1,2];

var myImage = withNDVI.first()

var collectData = function(feature){
  var myGeom = feature.geometry()
  var myReduction = myImage.reduceRegion({
                  reducer: ee.Reducer.mean(),
                  geometry: myGeom,
                  scale: 30            // Change to match your need
    })
  return(ee.Feature(myGeom,{mean: myReduction}))
}


var myNewFeatures = geometry.map(collectData) ;


for (var i in listOfNumbers) {
  var image = ee.Image(listOfImages.get(listOfNumbers[i]));
  var meanDictionary = image.reduceRegion({
  reducer: ee.Reducer.mean(),
  geometry:myNewFeatures.geometry()
  });

 var STDDictionary = image.reduceRegion({
  reducer: ee.Reducer.stdDev(),
  geometry:myNewFeatures.geometry()

});

// print(i,'mean',meanDictionary,'standard deviation',STDDictionary);

var std2 = ee.Number(STDDictionary.get("NDVI")).divide(2);
var mean1 = ee.Number(meanDictionary.get("NDVI"));

var negBorder=mean1.subtract(std2);
var posBorder=mean1.add(std2);

var imageNDVI=image.select('NDVI');
var gtPOS=imageNDVI.gt(posBorder).selfMask().rename('PositiveBorder');
var ltNEG=imageNDVI.lt(negBorder).selfMask().rename('NegativeBorder');
var betMEAN=imageNDVI.gt(negBorder).and(imageNDVI.lt(posBorder)).selfMask().rename('MeanBorder');

var PositiveCOL = {
  palette: [
  '006622'
  ],
};

var NegativeCOL = {
  palette: [
  'ff0000'
  ],
};

var MeanCOL = {
  palette: [
  '00ff00'
  ],
};


Map.addLayer(gtPOS,PositiveCOL,i);
Map.addLayer(ltNEG,NegativeCOL,i);
Map.addLayer(betMEAN,MeanCOL,i);


 }

