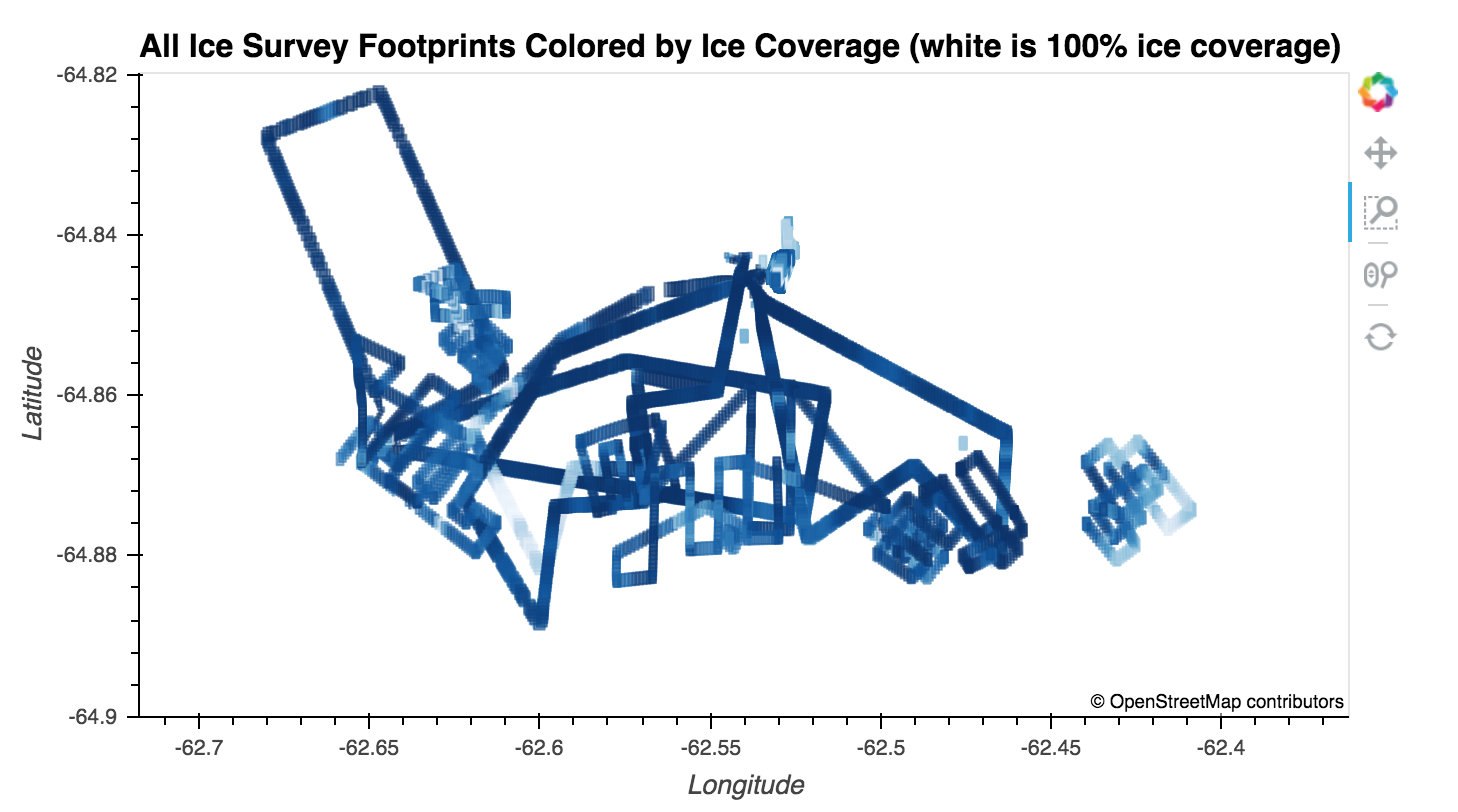
I have a geopandas dataframe of polygons (all rectangles ~100mx120m) and each of these polygons has an attribute for time and % ice coverage. This is all derived from imagery I collected in the Antarctic using a fixed wing drone and I have already turned the imagery into a calculation of ice coverage in each image. I now want to look at the spatial and temporal variability of ice coverage in these areas.
Ideally I would get some quantitate values telling me at what spatial distance ice coverage is no longer correlated (decorrelation scale) and after what length of time the ice coverage stops being correlated. I have thought about using variograms, but I'm not clear on how to do it with data of this form (polygons randomly spatially distributed with some spatial overlap on different surveys).
Here is what a subset of my survey looks like generally:
Any thoughts for how to do this? pysal seems promising but I'm struggling a bit with the documentation and I'm not sure if there is a better option for integrating with geopandas or just doing this without a specific package.
The files are available here and can of course be opened and inspected with the code below:
import geopandas as gpd
gdf = gpd.read_file('disco_coverage.shp')
gdf.head()

