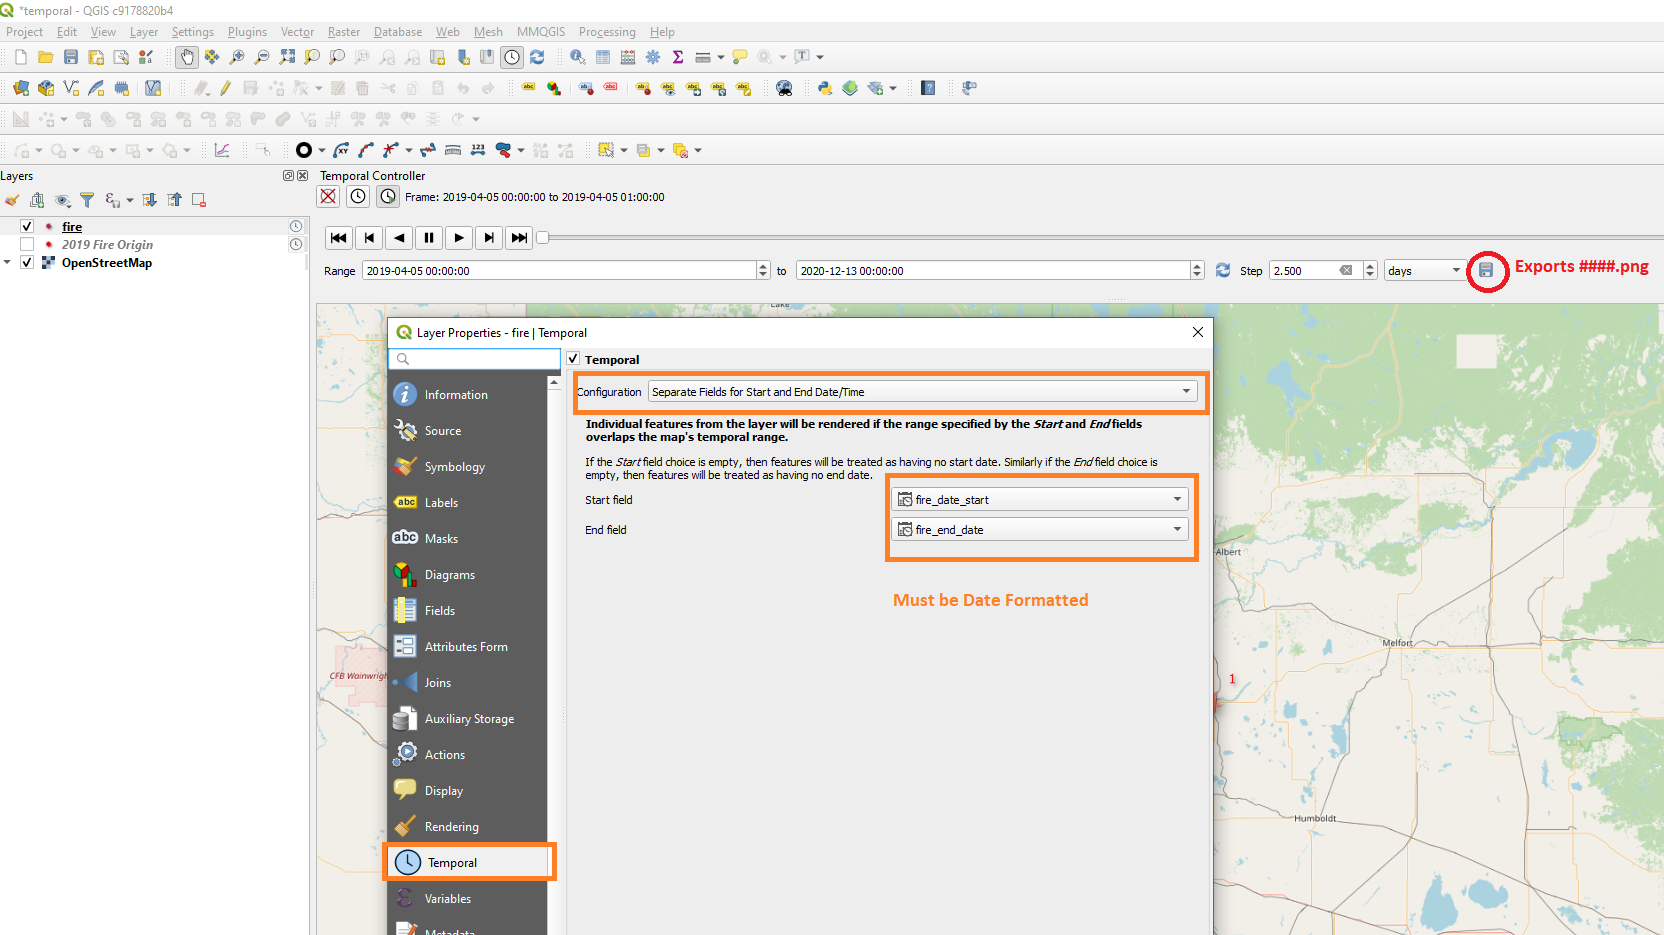
What is the easiest way to visualize the movement of city buses in QGIS, as it is shown at this website? https://anitagraser.com/2020/05/24/movement-data-in-gis-30-synchronized-trajectory-animations-with-qgis-temporal-controller/
There is a precise timetable for buses movement from the official site of public transport service of my city. It contains the information for each bus to bus-stop arrival time. Also I'm going to create a line layer of roads and point layer with bus-stops (I can create a point layer with points, laying on the roads near the bus-stops (using snapping options)) to show precisely places, where the buses exactly stop.
How can I create such an animation (as at Anita Graser's website) with not very much difficulty?

