I use R in order to calculate the Sen Slope trend for a raster stack (netcdf file) for each pixel, using the following code, from the SpatialEco library:
#
raster.kendall <- function(x, intercept = FALSE, p.value = FALSE, confidence = FALSE, tau = FALSE, ...)
  {
  if(!any(class(x) %in% c("RasterBrick","RasterStack"))) stop("x is not a raster stack or brick object")

  if( raster::nlayers(x) < 5) stop("Too few layers (n<5) to calculate a trend")

  trend.slope <- function(y, p.value.pass = p.value, tau.pass = tau, confidence.pass = confidence,
                          intercept.pass = intercept) {
    options(warn=-1)
    fit <- EnvStats::kendallTrendTest(y ~ 1)
    fit.results <- fit$estimate[2]
    if(p.value.pass == TRUE) { fit.results <- c(fit.results, fit$p.value) }
    if(confidence.pass == TRUE) {
      ci <- unlist(fit$interval["limits"])
      if( length(ci) == 2) {
        fit.results <- c(fit.results, ci)
      } else {
        fit.results <- c(fit.results, c(NA,NA))
      }
    }
    if(intercept.pass == TRUE) { fit.results <- c(fit.results, fit$estimate[3]) }
    if(tau.pass == TRUE) { fit.results <- c(fit.results, fit$estimate[1]) }
    return( fit.results )
  }
  k <- raster::overlay(x, fun=trend.slope, ...)
    names(k) <- c("slope", n)
  return( k )
}
I have tested the above code with many datasets of various resolutions and it worked fine. However, I lately used it with a very high resolution satellite precipitation product (0.0375 x 0.0375) and the results did not make any sense at all.
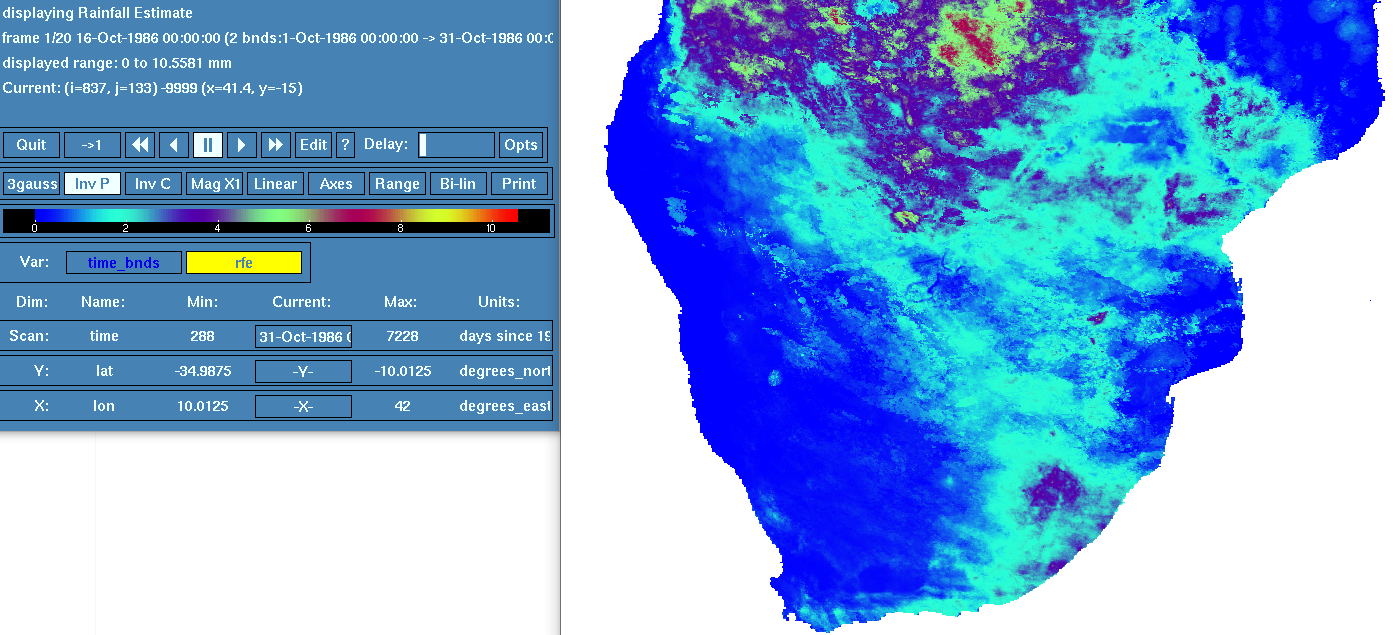
This is how the raw precipitation data look like:

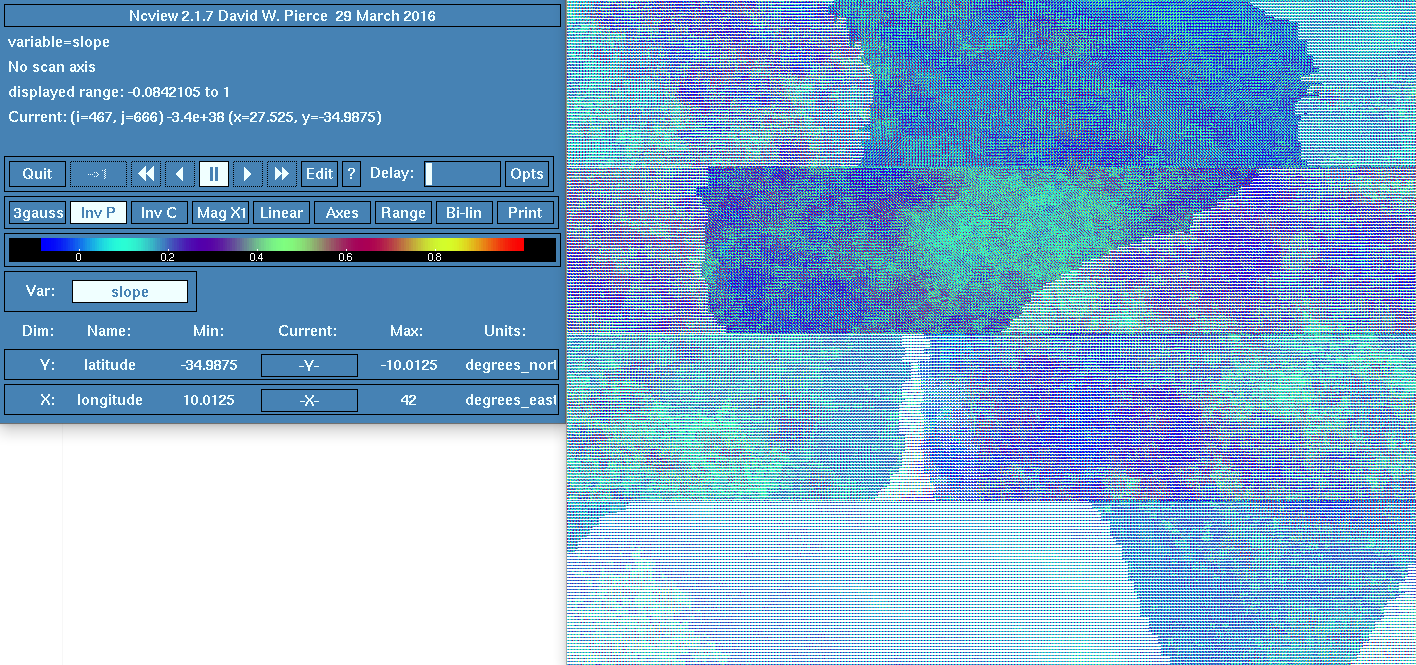
This is how the output (trend slope from raster.kendall) looks like:

I am reading the netcdf files in R as a raster stack and the code worked fine for all datasets with resolutions up to 0.05 x 0.05, however in this one, results are messy and I am wondering if its something that has to do with memory. A sample .nc file that I use can be found here.
library("raster")
library("maps")
library("rgeos")
library("grid")
library("ncdf4")
library("maptools")
library("mapdata")
library("rgdal")
library("lattice")
library("Kendall")
#
files = list.files(path="/my/path/.../", pattern="*.nc", full.names = T, recursive = T)
#
rast = stack()
trend_rast = stack()
trend_rast_mask = raster()
#
for (i in 1:length(files)) {
  print(files[i])
  rast = raster::stack(files[i])
  print(class(rast))
  file_name = print(files[i])
  trend_rast = raster.kendall(rast, intercept = F, p.value = T, confidence = F, tau = T)
  names(trend_rast) = c("slope","p.value","tau")
  trend_rast_sen = trend_rast[[1]]
  writeRaster(trend_rast_sen, paste("/my/output/.../", file_name, "_SEN_SLOPE", ".nc", sep=""), format="CDF", overwrite=TRUE)
}

spatialEco::raster.kendallto see if there have been changes that address the issue. Then, if you are having the sam issue, post a reproducible example. Inevitably, this is an issue with theraster::overlayfunction.