I am currently creating three carbon distribution maps for three different forest management scenarios. I created a shapefile map with a 1 km x 1 km grid and computed the carbon value per pixel (per km²). Now I created the maps and noticed following problem: In scenario 1 the highest carbon value is 13, in scenario 2 the highest value is 19. However value 13 and value 19 have the same color in the different maps, because they each are the highest values in their scenario. So what I need is that one color is always applied to the same value. I am using a graduated style.
1 Answer
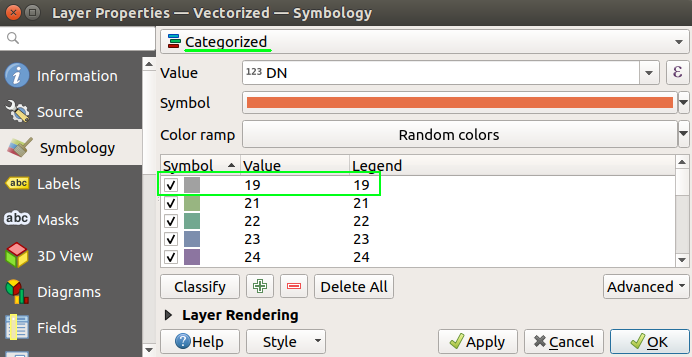
You can use the 'Categorized' type and define your own classes:
So that, they will stay fixed upon your different layers.
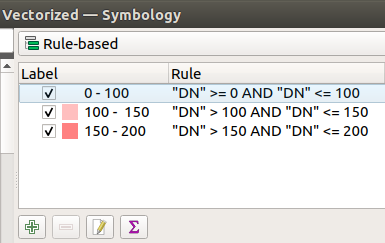
You can also go for some rule-based symbology if you want to fit some classes with precise intervals:
These are the best way to deal with discrete classes or categories.
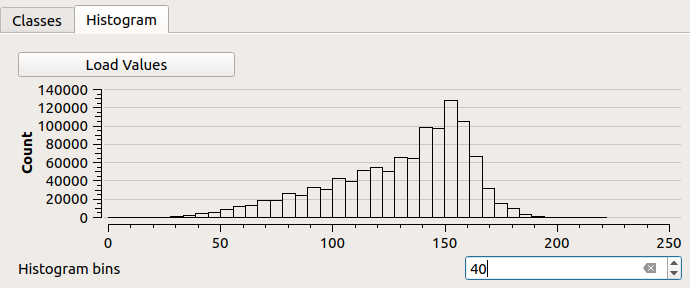
On the other hand, the graduated symbology is better suited for rendering a continuous phenomenon, e.g. based on its statistical distribution for example, because as you can see in the 'graduated' symbology, you can play with the histogram of your data in order to select how to apply your color map:


