0

I have a piece of code that reads in a .csv file and outputs a shapefile. After processing and altering the shapefile. The shapefile contains multiple polygons. I need to turn it back into the .csv, but am unsure how to "go backwards". I was thinking that I could do it somehow with the raster's resolution and polygons extents, but just am kind of confused with the process. Ultimately, I want to convert the .csv into an .xml.

Any advice?

training_csv = gpd.read_file('D:/data/farmer.csv')
training_csv.drop(['filename', 'width', 'height', 'class', 'geometry'], axis=1, inplace=True)

tif_file = 'D:/data/farmer/tif/0.tif'  # georeferenced TIFF
shp_path = 'D:/data/farmer/shape/'  # don't add extension

save_name = 0

# open georeferenced tif file
with rasterio.open(tif_file) as image:
    for i in training_csv.iterrows():
        xmin = float(i[1][3])
        ymin = float(i[1][2])
        xmax = float(i[1][1])
        ymax = float(i[1][0])

        # get vertices of the bounding box
        # geocoordinates from pixel coordinates
        p1 = image.xy(xmin, ymin)
        p2 = image.xy(xmax, ymin)
        p3 = image.xy(xmax, ymax)
        p4 = image.xy(xmin, ymax)
        print(p1)

        # save shapefile containing one bounding box shape
        w = shapefile.Writer(shp_path + str(save_name) + '.shp')
        w.field("name", "C")  # pyshp needs at least one field
        w.poly([[p1, p2, p3, p4]])  # generate bbox polygon
        w.record('bbox')
        w.close()

        # generate .PRJ file
        crs_wkt = image.crs.to_wkt()
        prj = open(shp_path + str(save_name) + '.prj', "w")
        prj.write(crs_wkt)
        prj.close()

        save_name = save_name + 1

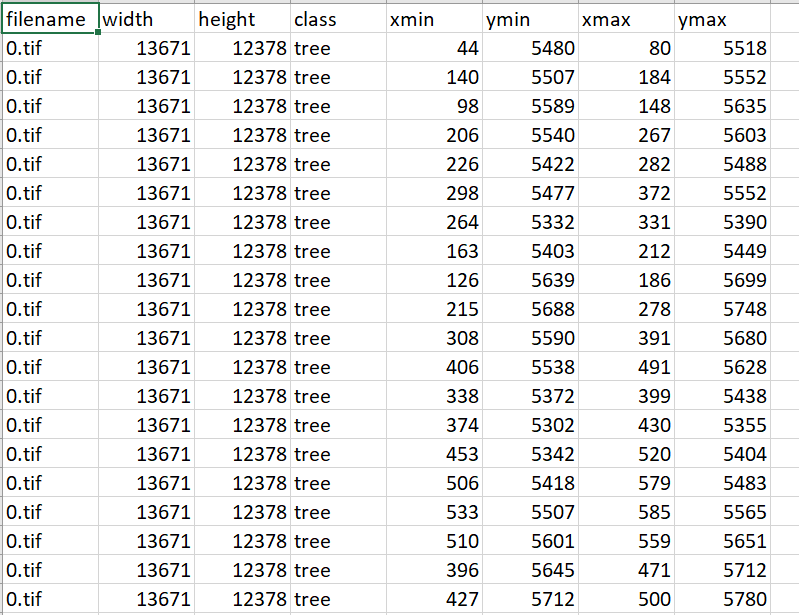
Original CSV

enter image description here

4
  • Each row in the csv contains the extent of one polygon. So in this picture I would have 20 polygons for 0.tif. For another tif file I could have 3 polygons. So on and so forth. Based on the tifs properties such as projection, the xmin, ymin, xmax, ymax coordinates are being converted into geocoordinates. So that I can properly view them in QGIS.
    – Binx
    Commented Mar 8, 2021 at 16:12
  • In QGIS I create a fishnet (lets say of 100x100ft). For simplicity sake lets say the csv above gets clipped into 5 polygons that contain 4 polygons each (20 polygons total). I need to take each of the polygons and turn their geo-extent-coordinates back into xmin, ymin, xmax, ymax based on a predetermined (0,0). Lets say the bottom left corner of the polygon that holds the smaller ones.
    – Binx
    Commented Mar 8, 2021 at 16:18
  • So from the csv above, convert each row to geo-referenced shp. Clip into smaller sections. Convert back to positions based on a determined (0,0) point.
    – Binx
    Commented Mar 8, 2021 at 16:21
  • Does that help?
    – Binx
    Commented Mar 8, 2021 at 16:21

1 Answer 1

3

I found something similar to convert shapefiles to CSV on deepforest. DeepForest is a python package for training and predicting individual tree crowns from airborne RGB imagery. The following code converts the shapefile to csv.

import os
import geopandas as gpd
import pandas as pd
import rasterio
import shapely
def shapefile_to_annotations(shapefile, rgb):
    """
    Args:
        shapefile: Path to a shapefile on disk. If a label column is present, it will be used, else all labels are assumed to be "Tree"
        rgb: Path to the RGB image on disk
    Returns:
        results: a pandas dataframe
    """
    # Read shapefile
    gdf = gpd.read_file(shapefile)

    # get coordinates
    df = gdf.geometry.bounds

    # raster bounds
    with rasterio.open(rgb) as src:
        left, bottom, right, top = src.bounds
        resolution = src.res[0]

    # Transform project coordinates to image coordinates
    df["tile_xmin"] = (df.minx - left) / resolution
    df["tile_xmin"] = df["tile_xmin"].astype(int)

    df["tile_xmax"] = (df.maxx - left) / resolution
    df["tile_xmax"] = df["tile_xmax"].astype(int)

    # UTM is given from the top, but origin of an image is top left

    df["tile_ymax"] = (top - df.miny) / resolution
    df["tile_ymax"] = df["tile_ymax"].astype(int)

    df["tile_ymin"] = (top - df.maxy) / resolution
    df["tile_ymin"] = df["tile_ymin"].astype(int)

    # Add labels is they exist
    if "label" in gdf.columns:
        df["label"] = gdf["label"]
    else:
        df["label"] = "Tree"

    # add filename
    df["image_path"] = os.path.basename(rgb)

    # select columns
    result = df[[
        "image_path", "tile_xmin", "tile_ymin", "tile_xmax", "tile_ymax", "label"
    ]]
    result = result.rename(columns={
        "tile_xmin": "xmin",
        "tile_ymin": "ymin",
        "tile_xmax": "xmax",
        "tile_ymax": "ymax"
    })

    # ensure no zero area polygons due to rounding to pixel size
    result = result[~(result.xmin == result.xmax)]
    result = result[~(result.ymin == result.ymax)]

    return result

results=shapefile_to_annotations(shapefile='pathtoshapfile.shp', rgb='path_to_tif.tif')

results.to_csv('path_to_save_csv')
1
  • Thanks for posting, I'll need to take some time to figure out why I needed this again. I'll get back to you!
    – Binx
    Commented Sep 1, 2021 at 17:11

Your Answer

By clicking “Post Your Answer”, you agree to our terms of service and acknowledge you have read our privacy policy.

Not the answer you're looking for? Browse other questions tagged or ask your own question.