4

[Edited title of post based on fact that @wingnut solved it]

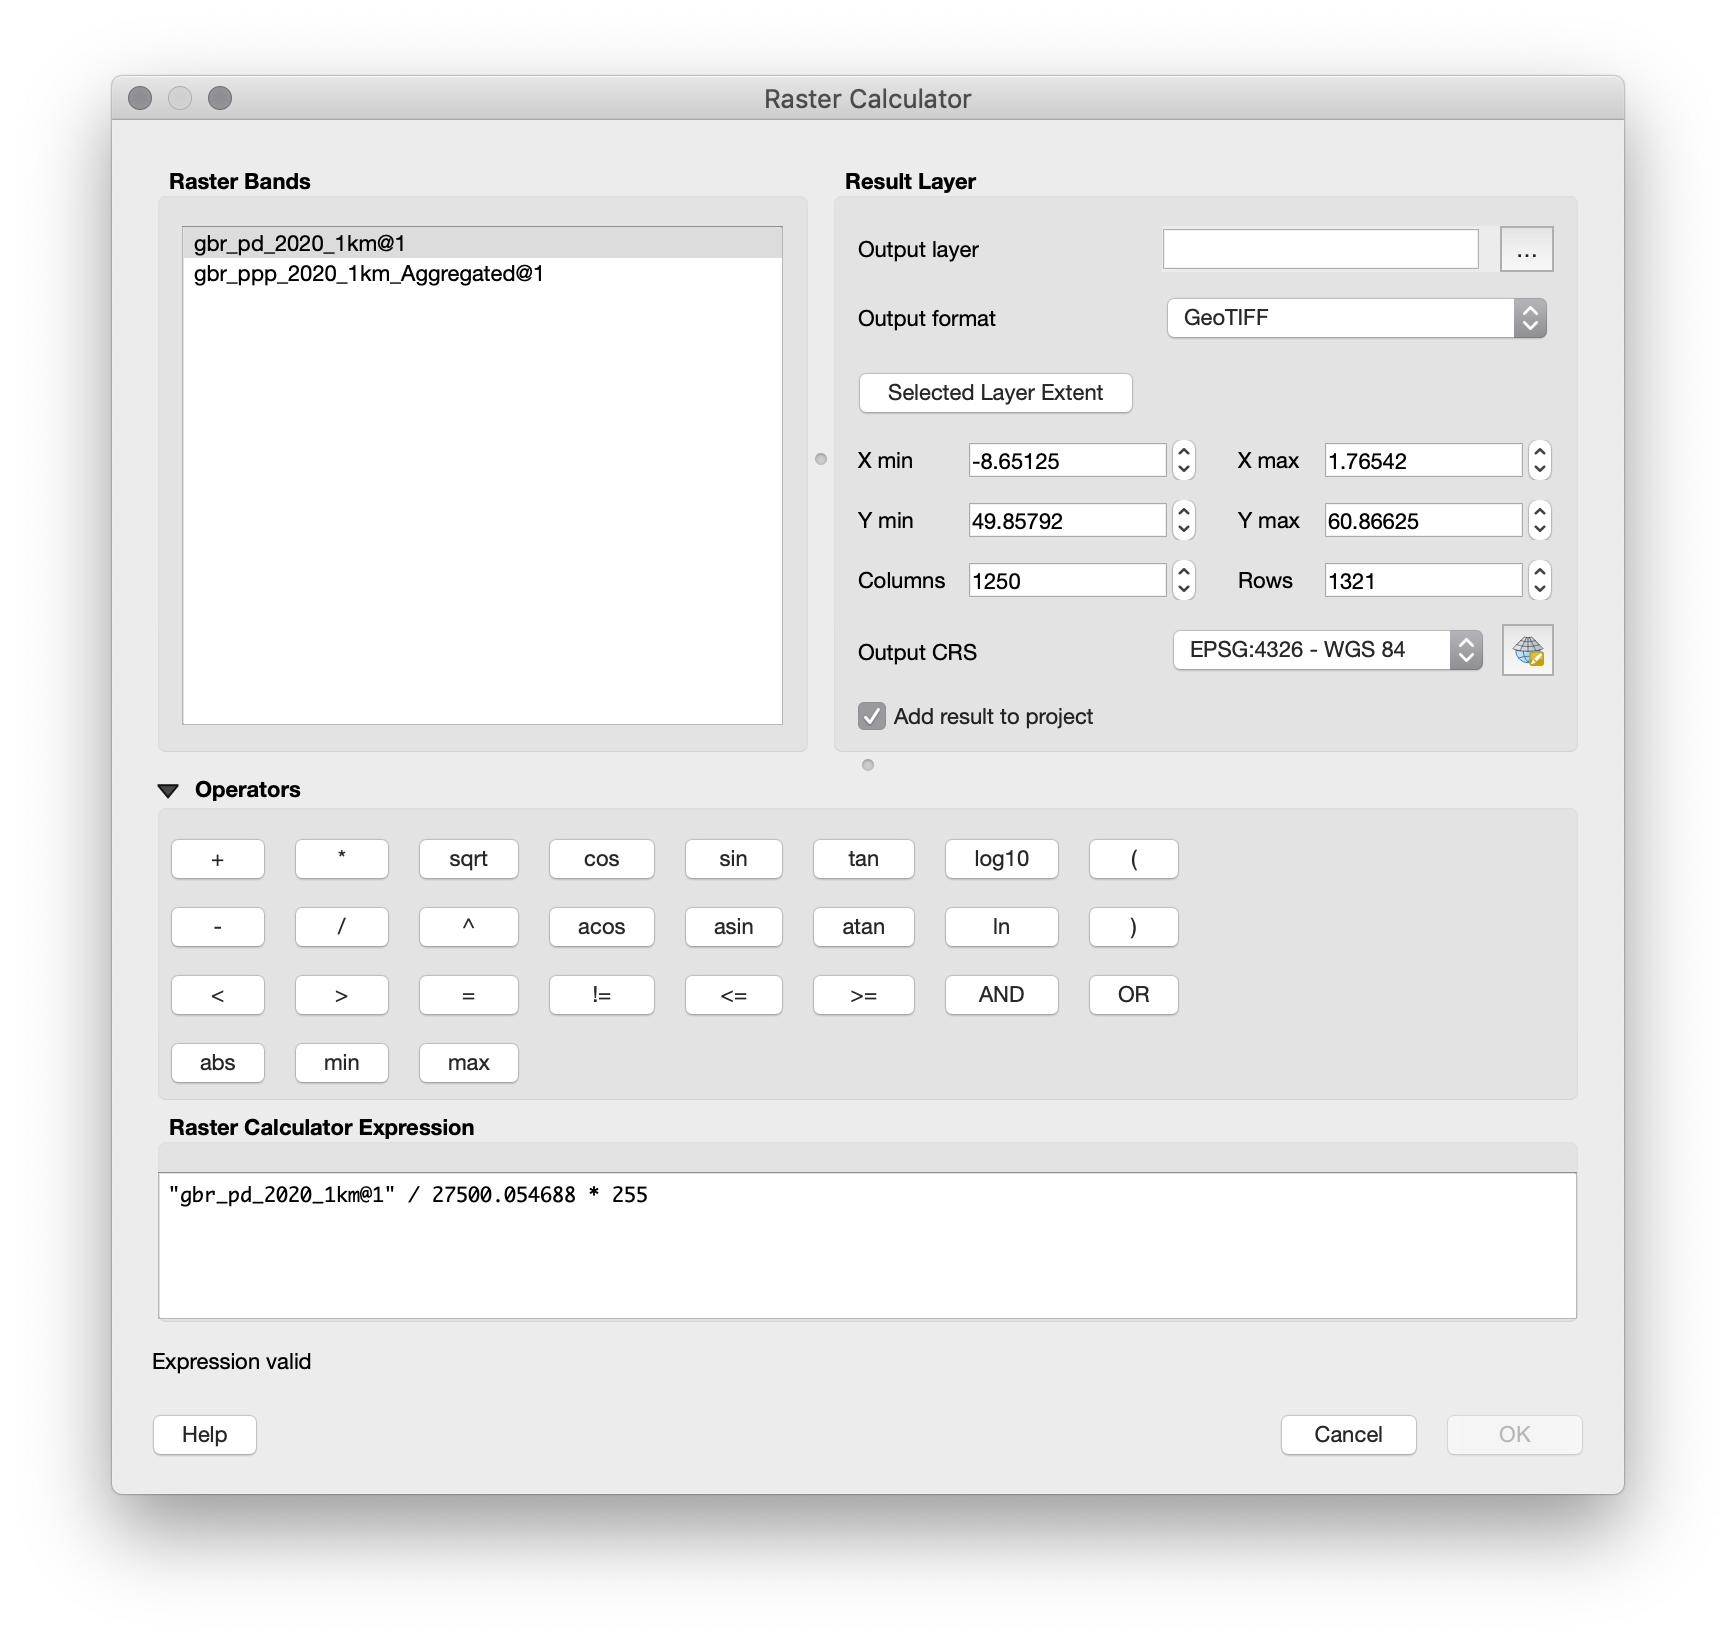
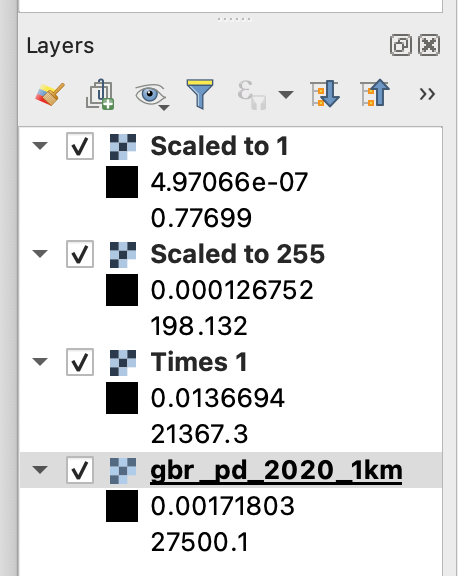
I'm trying to normalise a population density map such as this one (e.g. to a maximum of 255). The maximum value in the file to begin with is 27500.1. However, if I enter ("gbr_pd_2020_1km@1" * 255) / 27500.1 as a formula in the Raster Calculator it only gives me values up to 198.

What makes me further think it's a bug is if I just enter as a formula "gbr_pd_2020_1km@1" / 27500.1, it should give me values up to 1, but it only gives me values up to 0.8. And even if I just enter itself * 1 it only gives me values up to 21367!!! Please see

attached screenshot.

What I think must be happening is that the 27500.1 value is only in one pixel (which represents one area in London) and somehow the raster calculator is not looking at every pixel. But I can't see any settings to change this.

I've also tried doing the same via 'Processing Toolbox' then GDAL Raster Calculator, but it gives the same incorrect results.

I've tried this in QGIS 3.16.5 and 3.18 (the latest LTR and beta releases available), and am running it on the latest version of Mac OS (Big Sur 11.2.3).

3
  • I get a maximum for the input of 14687.8. Where did you get 27500.1? That's the max of the colorbar, not the data. Go to the Layer Styling panel and make sure you have selected the actual min and max, rather than a cumulative count, mean/stdev etc. See if it changes to 1468.7.
    – wingnut
    Commented Apr 17, 2021 at 17:42
  • @wingnut Thanks very much. Sorry I linked the wrong file. I meant the one below. However with the one I originally linked to, I have exactly the same problem if I divide by 14687.8 (or times by 1 etc.). data.worldpop.org/GIS/Population_Density/Global_2000_2020_1km/…
    – JohnH
    Commented Apr 17, 2021 at 19:01
  • 1
    Actually, it is working, but looks like it isn't. You need to change one thing. See my answer.
    – wingnut
    Commented Apr 18, 2021 at 6:51

2 Answers 2

6

This seems to happen by default. The maximum you see is an estimate based on sampling. You want the actual maximum of all samples in the raster.

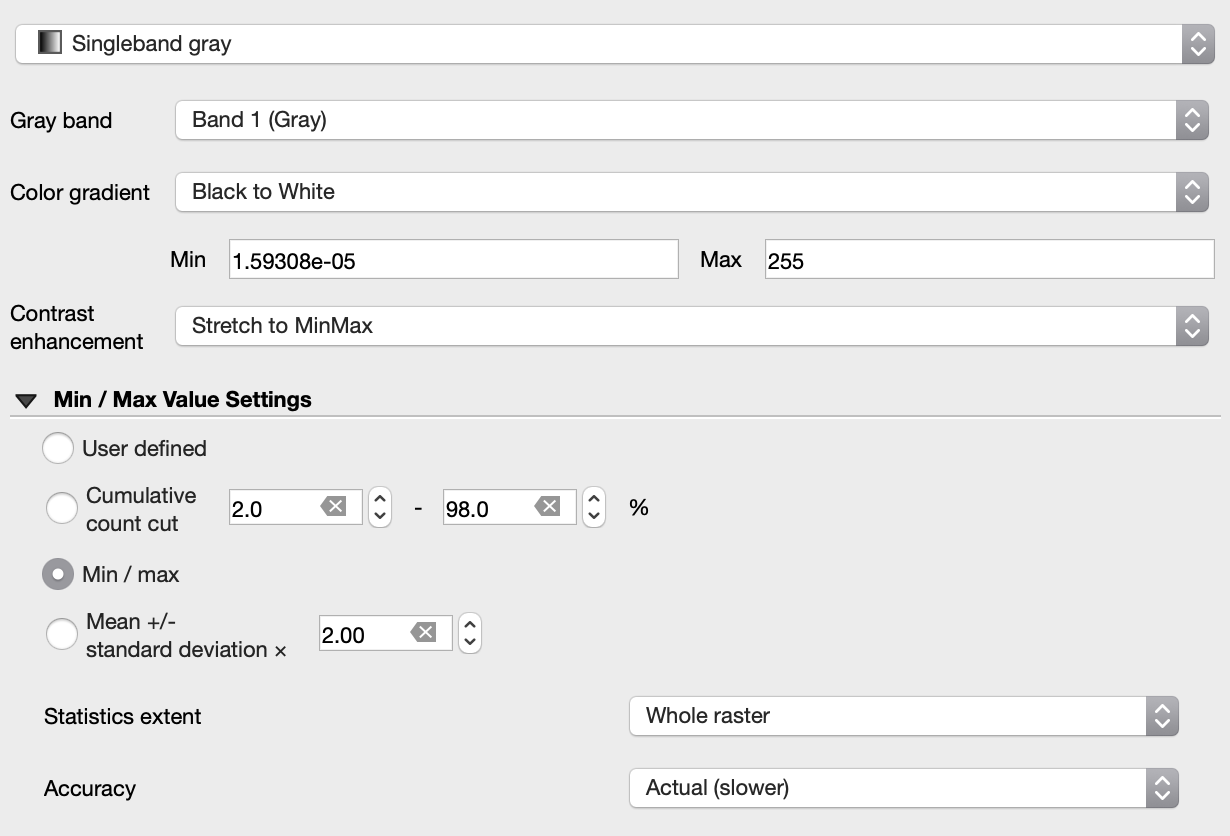
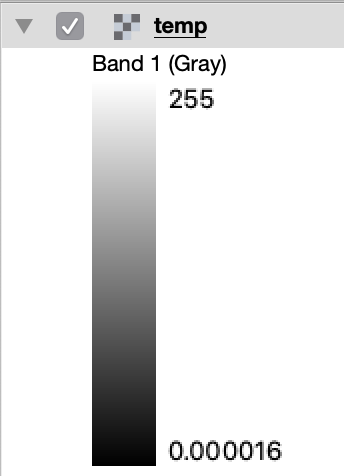
In the Layer Styling panel, under Accuracy, select Actual(slower). The legend should then display 255 as required.

Raster Calculator Setup

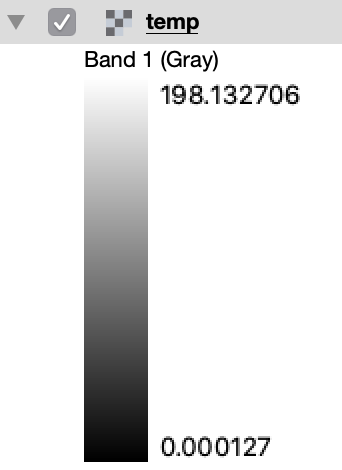
This produces the bad range, like this:

enter image description here

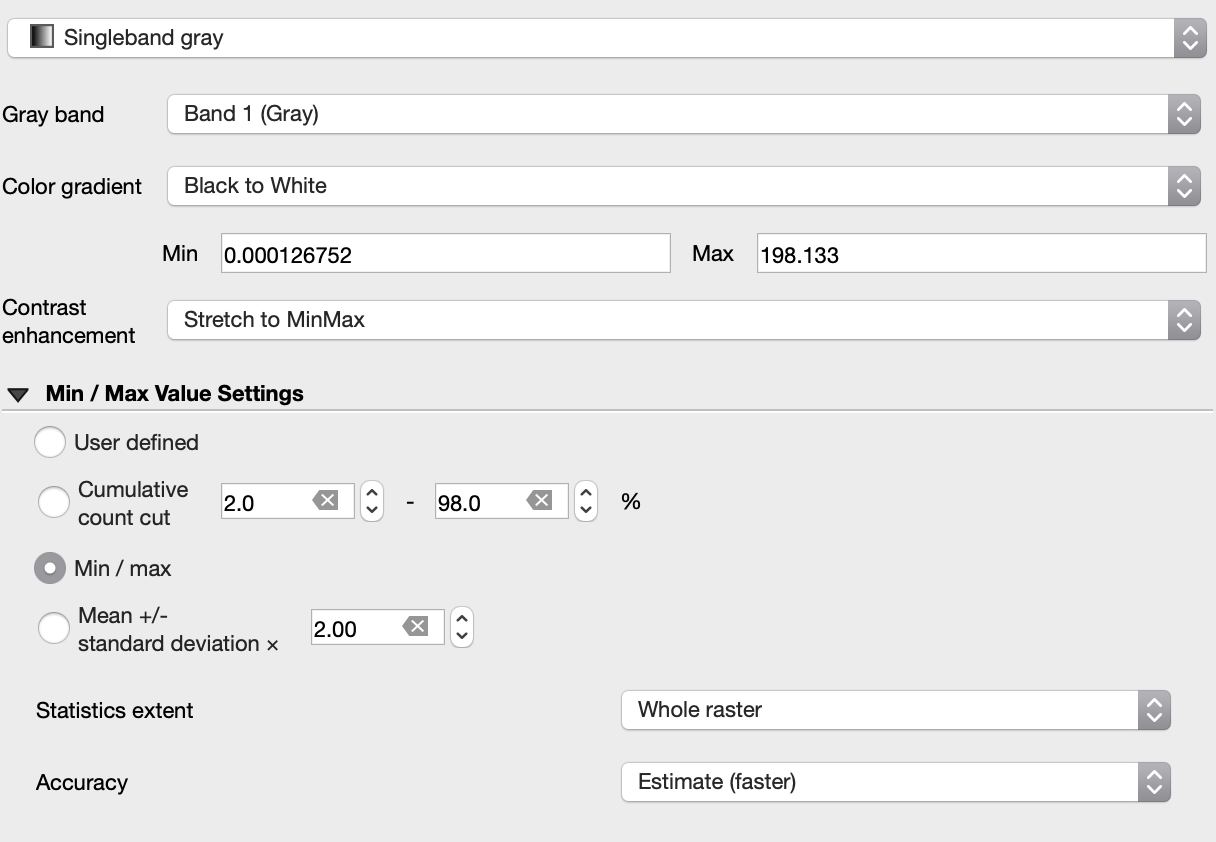
But if you look at the Layer Styling Panel, you see:

enter image description here

which looks wrong. Notice, however, that the Accuracy is set to Estimate(faster). Changing this to Actual(slower), 2 things happen. Firstly, the maximum in the Layer Styling panel changes to 255 as required:

enter image description here

Secondly, the legend updates to the new value:

enter image description here

3
  • 1
    well spotted, it is a bit strange that Estimate method is choosen by default. I understand it as consequences on rendering but at least, a warning should be displayed.
    – simo
    Commented Apr 18, 2021 at 8:37
  • Thanks very much wingnut and simo. Just to emphasise for others who are having this problem - it's the styling on the layer which you create that matters; not the original layer. I agree that it's strange that it doesn't default to 'correct' or flag a warning, or say anything in the tool or the manual on this. I appreciate you could say 'it's open source - you fix it' but I wouldn't know where to start (and would rather support others who like doing that). Anyway, thanks very much again!
    – JohnH
    Commented Apr 18, 2021 at 14:43
  • 1
    FYI, I have created a new feature request : github.com/qgis/QGIS/issues/42847
    – simo
    Commented Apr 18, 2021 at 16:04
2

I'm not familiar with raster format manipulation with QGIS but indeed, it sounds strange.

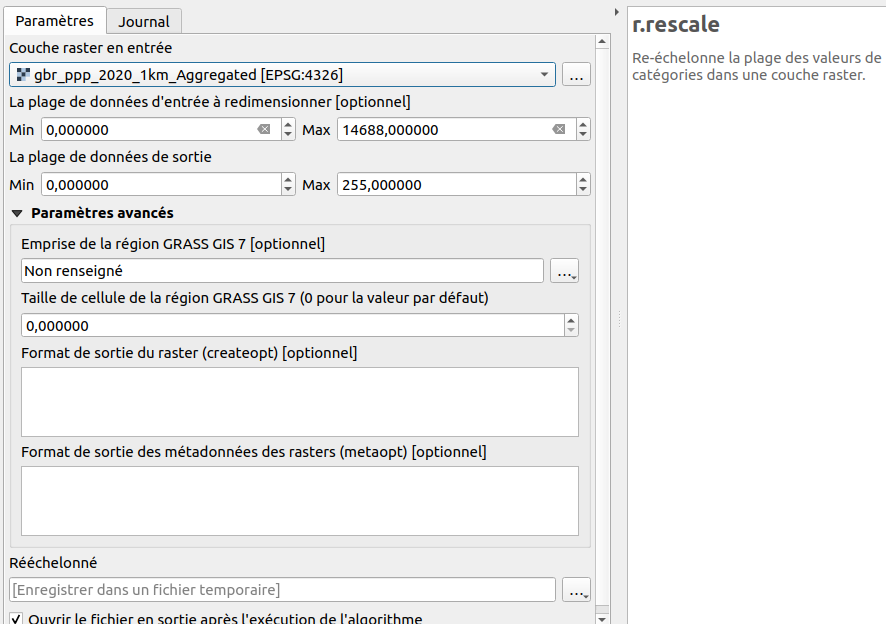
Anyway, you can get the wanted result by using grass r.rescale command (using Processing Tools) :

The r.rescale program rescales the range of category values appearing in a raster map layer. A new raster map layer, and an appropriate category file and color table based upon the original raster map layer, are generated with category labels that reflect the original category values that produced each category. This command is useful for producing representations with a reduced number of categories from a raster map layer with a large range of category values (e.g., elevation).

r.rescale

If you want to know more on r.rescale option, have a look on the documentation : https://grass.osgeo.org/grass79/manuals/r.rescale.html

And maybe notify the possible bug to the QGIS community : https://github.com/qgis/QGIS/issues

4
  • Ok thanks. I can't immediately get it to work (fails to give an output) but I'll read the documentation properly and try again. Many thanks for the response. Would you recommend another programme for raster manipulation e.g. arcgis?
    – JohnH
    Commented Apr 17, 2021 at 19:11
  • 1
    I love GRASS GIS because it is powerful and reliable ! I had no problem to rescale the raster you mentioned and linked in your first post, only by setting options as in screenshot.
    – simo
    Commented Apr 17, 2021 at 19:36
  • It will have the same problem (he was displaying the estimated maximum, not the actual maximum) in the QGIS Layer Styling panel.
    – wingnut
    Commented Apr 18, 2021 at 6:53
  • @wingnut : no, it displays 0 to 255 values, because by default when new raster layer is created it is displayed as 'Palette / unique value". But you're right, same rendering option apply when switching to "pseudo color ..." render.
    – simo
    Commented Apr 18, 2021 at 9:00

Your Answer

By clicking “Post Your Answer”, you agree to our terms of service and acknowledge you have read our privacy policy.

Not the answer you're looking for? Browse other questions tagged or ask your own question.