I seek help on:
- Finding possible errors on projections management
- Guiding me on which should be the best way to know which "labels - colors" are within the path line (not exposed here)
--
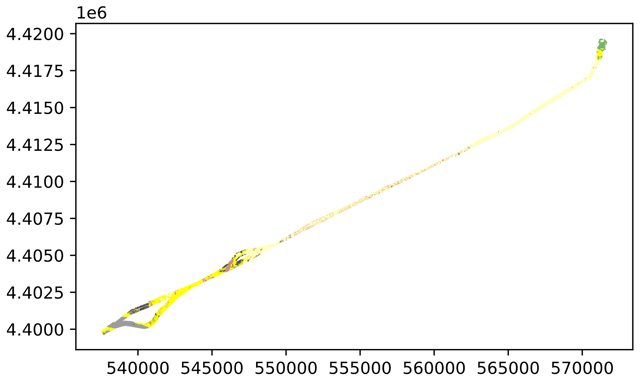
Source 1: Geopandas imported from ArcMap in .shp format - It contains all shapes (4k) and is used as the basic map. It's very populated in terms of ArcMap columns and attributes
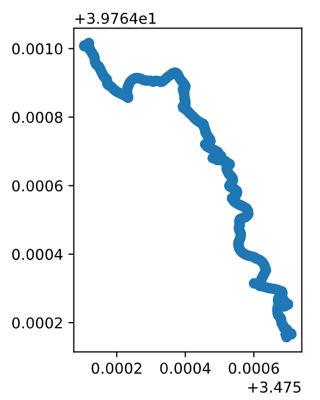
Source 2: Geopandas imported from KML coordinates in .csv format - It's a ROV path in UTM 31N zone.
Steps done:
Import and plot ArcMap representation in GeoPandas. Done! "The same" as ArcMap
Import and plot KML path in GeoPandas. Done!
Make them work in the same CRS
# print(gdf.crs) == > epsg:32631

# Source 2 is directly readed from CSV. Need to assign geocode.
# For a non GIS guy, makes sense to apply || epsg: 32631 or 25831

# print(track.crs) == > 32633   Value determined automatically. As the input for source 2 is just KML coordinates
track = track.to_crs(gdf.crs)


print(gdf.crs)     # After conversion, both are the same: epsg:32631
print(track.crs)

# Follow the convention of plotting both geoPandas by sharing an axes
fig, axes = plt.subplots(figsize=(15,15))
gdf.plot(ax=axes, color=gdf['Color'])
track.plot(ax=axes)
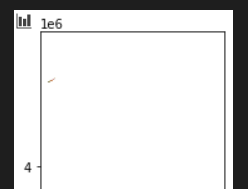
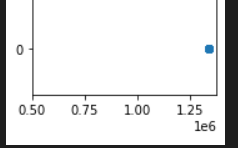
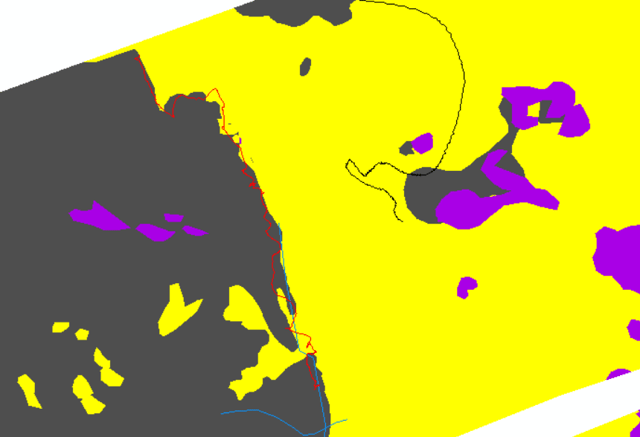
Incorrect output:
Can you see the miniature of SOURCE 1?
I assume this point is my KML path:
What I expected
(picture from ArcMap):

track = track.to_crs(gdf.crs)[....]