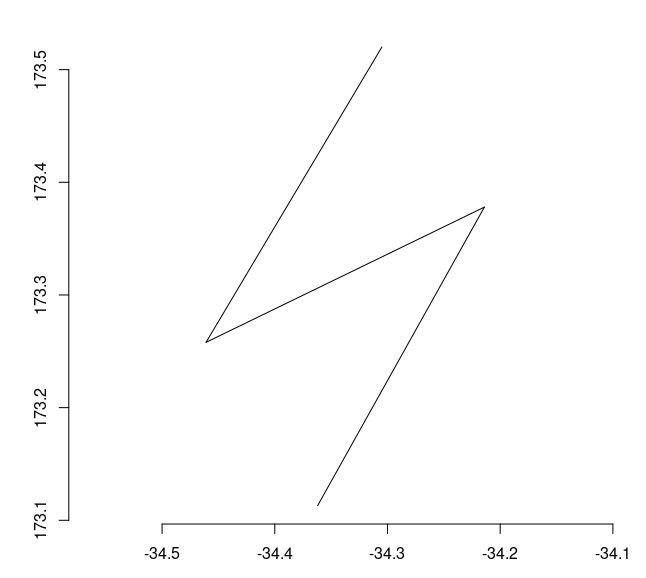
I need to create multiple linestrings (transects) based on multiple coordinates, and then plot them (for a study area map) and later on, I will use these lines for joining attributes from another data set and in other spatial analyses.
The first part --creating the linestrings-- seems to work fine for me, based on all (great) answers in R - Create multiple linestrings from multiple coordinates & Guzmán's answer in R: sf package points to multiple lines with st_cast. If I use mapview::mapview(), they all return the transects. But when I try to plot it through ggplot2 it returns me:
Error in st_transform.sfc(X[[i]], ...) : cannot transform sfc object with missing crs
When I set a crs and try to plot it, it plots in a completelly different location than expected (pretty much out of the globe, hehe). I've tried setting the crs in different parts of the code, check the ## in the code below, e.g. inside the function in st_linestring, and outside the function in st_sfc, st_sf, or even using st_crs(lines) <- 4326.
Please find below the code I'm using.
library(tidyverse); library(rnaturalearth); library(sf); library(mapview)

df_tbl <- tibble::tribble(
  ~lat,   ~lon,   ~lat2,   ~lon2,
  -34.305, 173.520, -34.461, 173.258,
  -34.461, 173.258, -34.214, 173.378,
  -34.214, 173.378, -34.362, 173.113)

rows <- split(df_tbl, seq(nrow(df_tbl)))

lines <- lapply(rows, function(row) {
  lmat <- matrix(unlist(row[1:4]), ncol = 2, byrow = TRUE)
  st_linestring(lmat) # I've tried crs = 4326 here
})

lines <- st_sfc(lines) # I've tried crs = 4326 here

lines_sf <- st_sf('ID' = 1:3, 'geometry' = lines) # I've tried crs = 4326 here

# st_crs(lines) <- 4326 # And I also tried like this...

mapview::mapview(lines_sf)
I'm trying to plot it along with the tip of New Zealand's North Island:
nz_sf <-
  rnaturalearth::ne_countries(scale = "medium",
                              country = "new zealand",
                              returnclass = "sf")

## After setting a 'crs' for 'lines_sf'
p <-
  ggplot() +
  geom_sf(data = nz_sf) +
  coord_sf(xlim = c(172.5,173.8), ylim = c(-34.2,-34.9))+ # This just work if the line below is commented
  geom_sf(data = lines_sf) +
  theme_bw()
Checking attributes(lines_sf$geometry) shows me that, apparently, it's all good with projection.
It is the first time I'm "building" spatial features inside R from scratch, and I might be doing something wrong. What am I missing?


library(tidyverse)- it pulls in so many packages you don't need here. You only needggplot2andtribble, and you don't really needtribblefor making examples. The lighter you can keep your examples the easier they are for people to run.