1

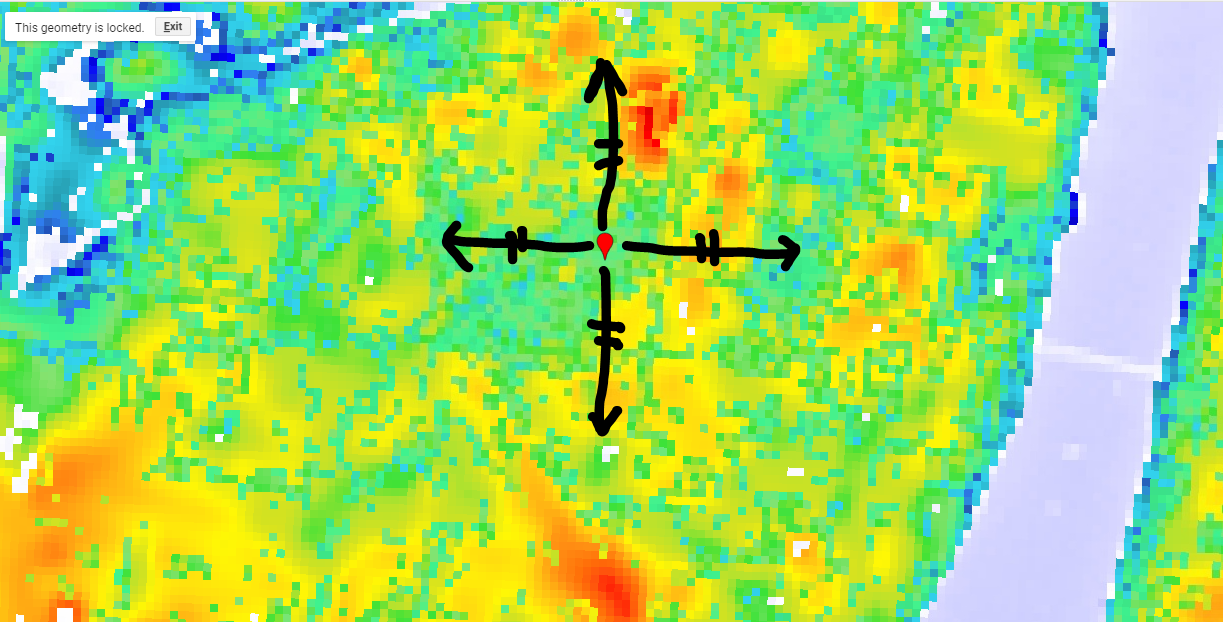
I am quite new to both Google Earth Engine and JavaScript. I have an LST image for all the regions. I want to extract LST pixels from east to west and from north to south around POI. Where the black line indicates in the figure. (in the range of 5-10 km)

enter image description here

My goal is to draw the following graph with the extracted pixels.

enter image description here

How do I do it using the Google Earth Engine JavaScript API.

Here is my code so far.

Map.centerObject(py_point, 9.5);

// Select Landsat 8 TOA image (CLOUD_COVER_LAND is less than 5%)
var col_l8 = ee.ImageCollection(l8_TOA
  .filterBounds(py_point)
  .aside(print)
  .filterDate('2019-01-01', '2019-12-31')
  .filterMetadata('CLOUD_COVER', 'less_than', 5)
  .select(['B4', 'B5', 'B10'])); // 2019-05, 2019-09
print(col_l8, 'l8_2019');

// Define a function that will add an NDVI band to a Landsat 8 image.
var addNDVI = function(image) {
  var NDVI = image.normalizedDifference(['B5', 'B4']).rename('NDVI');
  return image.addBands(NDVI);
};

// Add an NDVI band 
var ndviAdded_2019 = ee.ImageCollection(col_l8
  .map(addNDVI));
print(ndviAdded_2019.first(), 'ndvi_2019');

// Emissivity

var addEM = function emissivity(image){
  var ndvi = image.select('NDVI');
  var e1 = ee.Number(0.995);
  var e2 = ee.Number(0.97);
  var e3 = image.expression(
    '1.0094 + 0.047*(log(NDVI))', {
      'NDVI': image.select(['NDVI'])
    });
  var e4 = ee.Number(0.99);


  var emis1 =  ee.Image(ndvi.lt(-0.185)).multiply(e1)
    .rename('emis1');
  var emis2 =  ee.Image(ndvi.gte(-0.185)).and(ndvi.lt(0.157)).multiply(e2)
    .rename('emis2');  
  var emis3 =  ee.Image(ndvi.gte(0.157)).and(ndvi.lt(0.727)).multiply(e3)
    .rename('emis3');
  var emis4 =  ee.Image(ndvi.gt(0.727)).multiply(e4)
    .rename('emis4');

    
  var em = image.expression(
    'emis1 + emis2 + emis3 + emis4', {
      'emis1': emis1.select('emis1'),
      'emis2': emis2.select('emis2'),
      'emis3': emis3.select('emis3'),
      'emis4': emis4.select('emis4')
  }).rename('EM');
  
  return image.addBands(em);
}

// Add an EM band 
var emAdded_2019 = ee.ImageCollection(ndviAdded_2019
  .map(addEM));
  
print(emAdded_2019.first(), 'em_2019');

// Calculate Emissivity Pow
var addEmPow = function(image){
  var pow = image.select('EM').pow(ee.Number(0.25))
  .rename('EM_P');
    
  return image.addBands(pow);
};

// Add an EM_P band 
var empAdded_2019 = ee.ImageCollection(emAdded_2019
  .map(addEmPow));
print(empAdded_2019.first(), 'emp_2019');

// Calculate LST(Celcius)
var addLST = function(image) {
  var lst = image.expression(
    '(T * EM_P) - 273.15', {
      'T' : image.select(['B10']),
      'EM_P': image.select(['EM_P'])}
    ).rename('LST');
  return image.addBands(lst); 
};
                         
var lstAdded_2019 = ee.ImageCollection(empAdded_2019
  .map(addLST));
print(lstAdded_2019.first(), 'lst_2019');

Map.addLayer(lstAdded_2019.first().select('LST'), {
  min: 13, 
  max: 35, 
  palette: ['040274', '040281', '0502a3', '0502b8', '0502ce', '0502e6',
            '0602ff', '235cb1', '307ef3', '269db1', '30c8e2', '32d3ef',
            '3be285', '3ff38f', '86e26f', '3ae237', 'b5e22e', 'd6e21f',
            'fff705', 'ffd611', 'ffb613', 'ff8b13', 'ff6e08', 'ff500d',
            'ff0000', 'de0101', 'c21301', 'a71001', '911003']
},
'LST');

https://code.earthengine.google.com/3f06a4423337c51894dc1b4eebe63ad3?accept_repo=users%2Fstacemaples%2FSGC-EE101

0

1 Answer 1

1

Here's a stab at solving this. For the east-west case (north-south is essentially the same): An image where each pixel represent the distance to the point is combined with the LST band, pixels not on the east-west line are masked out, and features with distance and LST are created for every non-masked out pixel.

var image = lstAdded_2019.first().select('LST')

var eastWestFeatures = extractEastWestFeatures(image, py_point, 5000)
var eastWestChart = ui.Chart.feature.byFeature({
  features: eastWestFeatures.sort('distance'), 
  xProperty: 'distance', 
  yProperties: ['LST']
})
print('east-west', eastWestFeatures)
print(eastWestChart)

var northSouthFeatures = extractNorthSouthFeatures(image, py_point, 5000)
var northSouthChart = ui.Chart.feature.byFeature({
  features: northSouthFeatures.sort('distance'), 
  xProperty: 'distance', 
  yProperties: ['LST']
})
print('north-south', northSouthFeatures)
print(northSouthChart)


function extractNorthSouthFeatures(image, point, radius) {
  var lon = point.coordinates().getNumber(0)
  var northSouthLine = ee.Geometry.LineString({
    coords: [[lon, -90], point.coordinates(), [lon, 90]]
  })
  return extractFeatures(image, point, radius, northSouthLine)
}


function extractEastWestFeatures(image, point, radius) {
  var lat = point.coordinates().getNumber(1)
  var eastWestLine = ee.Geometry.LineString({
    coords: [[-180, lat], point.coordinates(), [180, lat]], 
    geodesic: false
  })
  return extractFeatures(image, point, radius, eastWestLine)  
}


function extractFeatures(image, point, radius, geometry) {
  var mask = geometryToMask(geometry)
  var distance = distanceToGeometry(point)
  return ee.FeatureCollection(distance
    .addBands(image)
    .updateMask(mask)
    .reduceRegion({
      reducer: ee.Reducer.toCollection(ee.List(['distance']).cat(image.bandNames())), 
      geometry: point.buffer(radius, 30), 
      scale: 30, 
      maxPixels: 1e13
    })
    .get('features')
  )
}


function distanceToGeometry(geometry) {
  var pointMask = geometryToMask(geometry)
  var distancePixels = pointMask.fastDistanceTransform(1024)
    .sqrt() // fastDistanceTransform() return squared distance
  return distancePixels.multiply(ee.Image.pixelArea().sqrt()) // Convert to meters
}


function geometryToMask(geometry) {
  // Hack to convert a geometry to an image mask.
  // We don't care about the image values produced by reduceToImage(),
  // so we just add a 0 property and pick the first one when reducing.
  // Is there a cleaner way to do this?
  return ee.FeatureCollection([ee.Feature(geometry, {_: 0})])
    .reduceToImage(['_'], ee.Reducer.first())
    .mask()  
}

https://code.earthengine.google.com/59eea3a94950885281dae6b615c13914?accept_repo=users%2Fstacemaples%2FSGC-EE101

1
  • Hello Daniel, Could it be possible to plot the lines-transects on the map to see plotted from which point to which point is extracting the LST values? Could it be also possible as well to extract simultaneously several pixel values corresponding to different images in addition to LST, for instance NDVI and others, etc. as a table for exporting it to drive as CSV? Thanks a lot!
    – Gab
    Commented Feb 7, 2022 at 17:29

Your Answer

By clicking “Post Your Answer”, you agree to our terms of service and acknowledge you have read our privacy policy.

Not the answer you're looking for? Browse other questions tagged or ask your own question.