1

I have a shapefile which divides Africa in cells of 0.5x0.5 decimal degrees. This documents provides the longitude, latitude of the centroid of the cell and a unique identified of each cell.

On the other hand, I have a CSV file with different observations and different variables, including longitude and latitude among the variables. I transform this as a GeoPackage and they appears as a point in the QGIS.

enter image description here

Taking advantage of the latitude and longitude of the CSV file, I use a "Join Attributed by Location". Input Layer: my shp file; Join layer: my GeoPackage (before my CSV file); Geometric Predicate: I use the option "Intersects".

My main objective is to add to the grid cell the number of events of the CSV. For example, if according to the longitude and latitude of the CSV file, there are five events in a grid cell, I would like to obtain five observations in this grid cell. If I do not have any observation in one grid cell, the variables remain missing.

I do it without any problem. However, when I check the CSV that I export after doing the join, the number of observations are lower.

How is it possible? What I am doing wrong?

It should be greater than my original CSV, because it has to include all the observations of the CSV plus the grid cells that does not have any event.

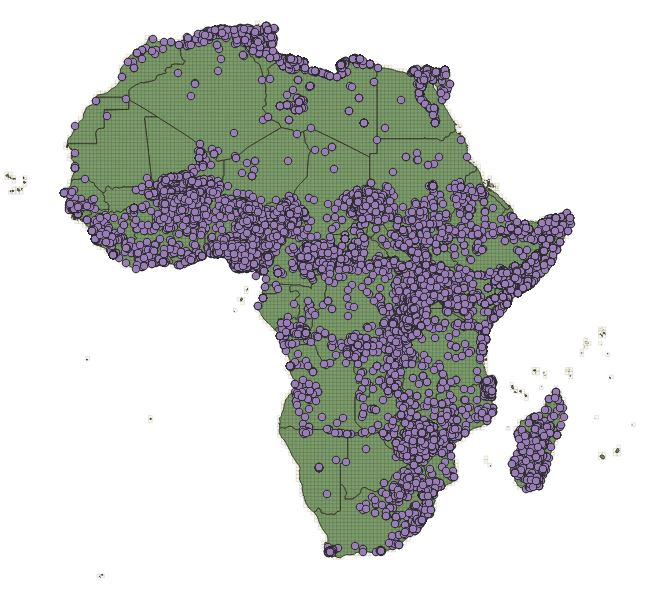
I show the following picture. It is Africa divided in the grid cell and the points are the CSV. So, I would like to join the points to the grid cell. My version of QGIS is 3.20.1

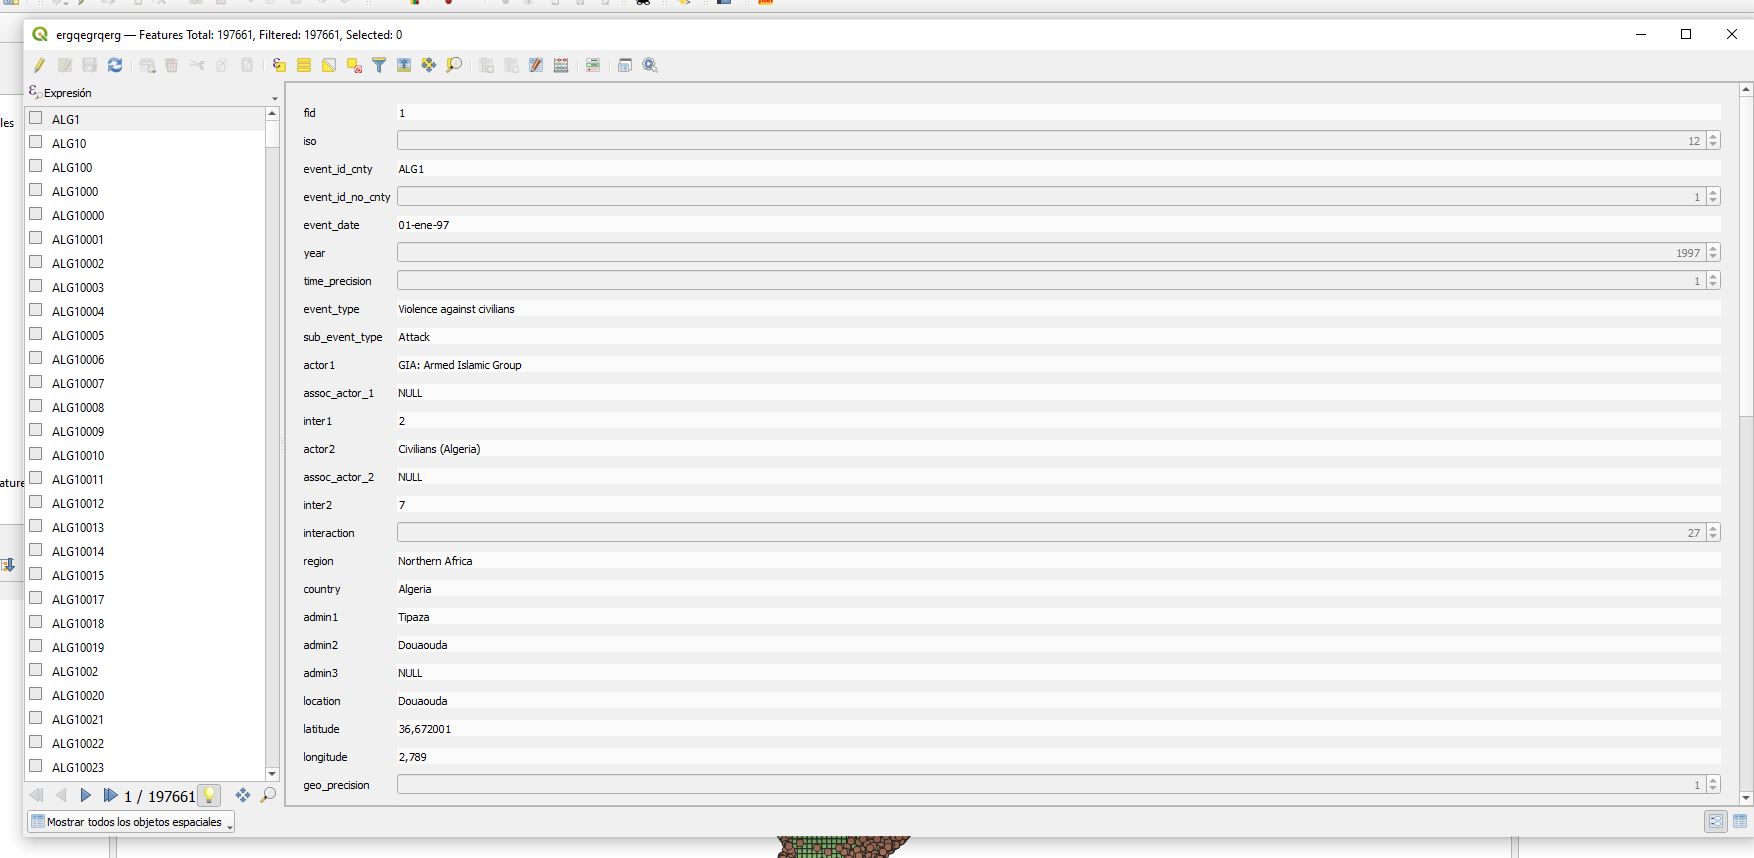
This is the screen shot of my GeoPackage file (before CSV)

enter image description here

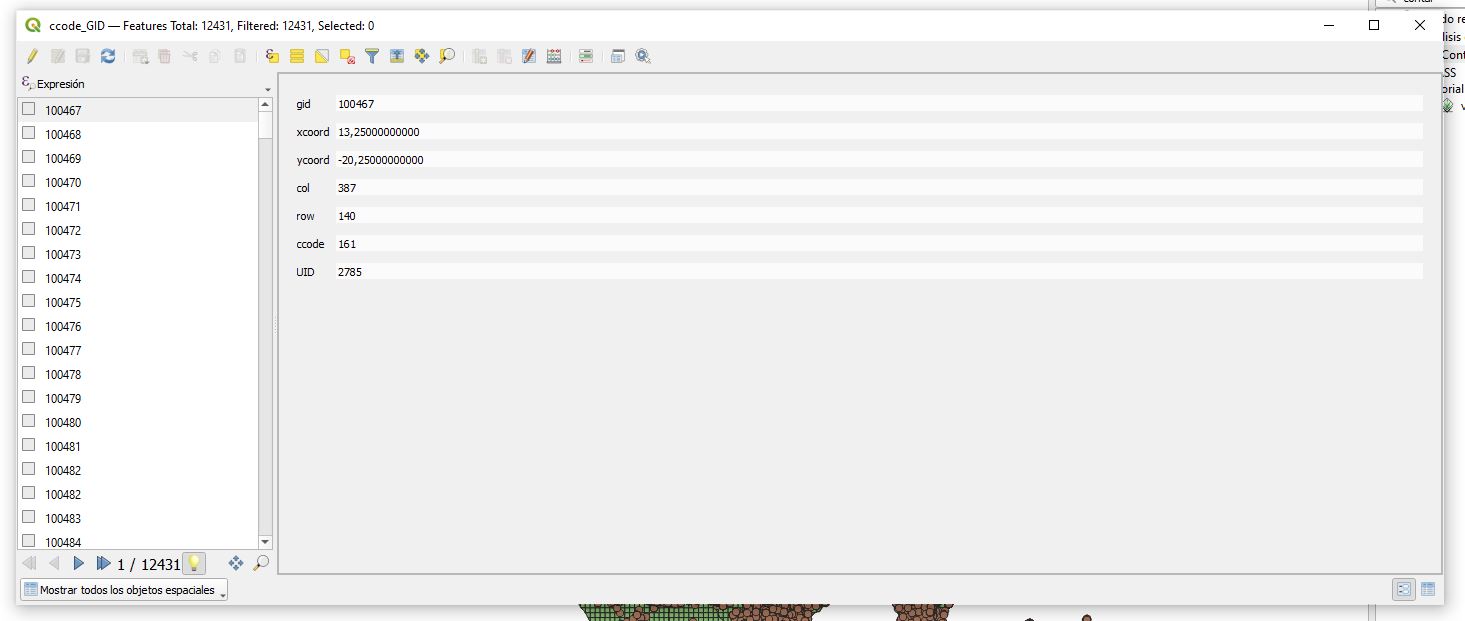
This is the screenshot of my shapefile:

enter image description here

7
  • Sorry for my ignorance, but what is the CRS?
    – OgeiD
    Commented Dec 14, 2021 at 8:44
  • 1
    its coordinate reference system for each layer.
    – LM10
    Commented Dec 14, 2021 at 8:50
  • 1
    Did you use the tool "join by location (summary)" ? With that tool you can choose the field to summarize (here: "number of events") and then you can choose the "summaries to calculate" (here: sum).
    – wanderzen
    Commented Dec 14, 2021 at 8:50
  • @LM10 Thank you for your answer. How can I check if they have the same coordinate reference system?
    – OgeiD
    Commented Dec 14, 2021 at 8:52
  • 1
    you can check CRS in layer properties (informations) .
    – LM10
    Commented Dec 14, 2021 at 8:55

3 Answers 3

6

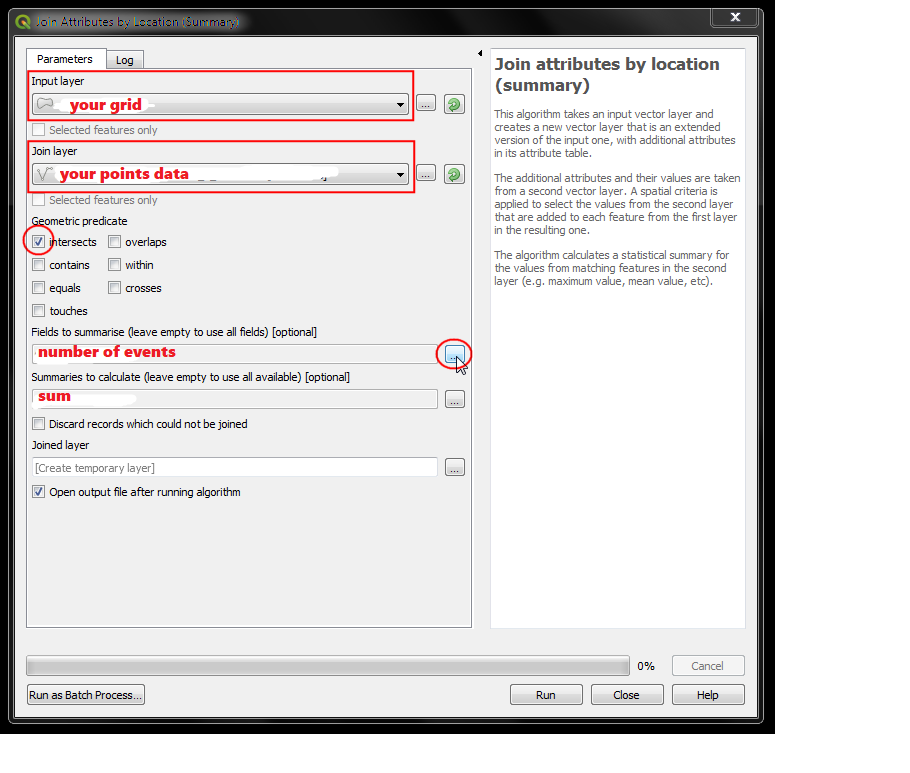
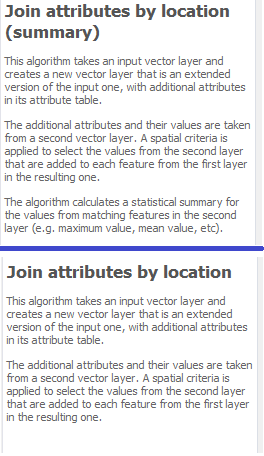
I guess you should use the tool "Join attributes by location (summary)".

Here is a picture explaining quickly how you should proceed:

enter image description here

Differences between "join by location (summary)" and "join by location":

enter image description here

8
  • Thank you @wanderzen . I will do it. However, can you say to me, what is the difference between both and why the join attributes that I were using does not work and this yes?
    – OgeiD
    Commented Dec 14, 2021 at 8:59
  • 1
    You're very welcome @OgeiD ! I've just added a picture explaining the differences between the 2 tools in my answer :)
    – wanderzen
    Commented Dec 14, 2021 at 9:06
  • Thank you wanderzen. I appreciate you help because this is important for me. From what I see, both are identical with the exception that the summary one creates a statistical summary. However, I do not see how this solve my problem in which my new output has fewer observations than the original one.
    – OgeiD
    Commented Dec 14, 2021 at 9:24
  • Could you add a sceenshot of the attribute tables of both of your layers (grid and points) ? It would help us to better understand your issue
    – wanderzen
    Commented Dec 14, 2021 at 10:04
  • I have added in the first comment.
    – OgeiD
    Commented Dec 14, 2021 at 10:41
5

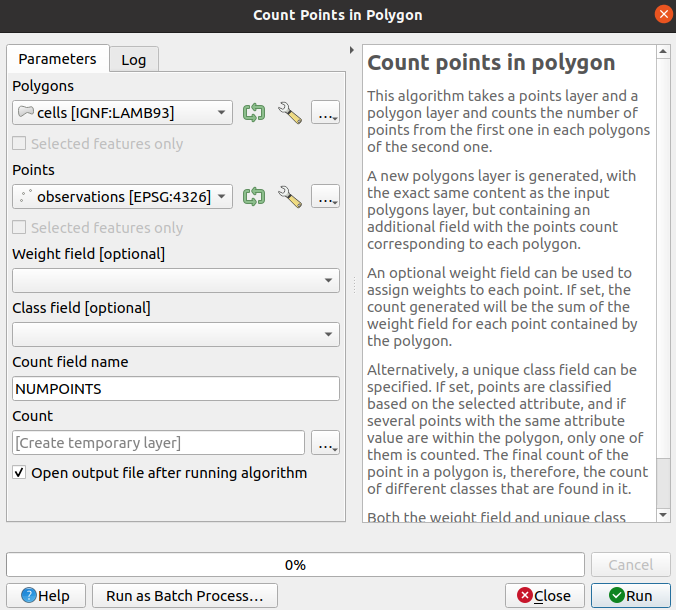
If you just want to know the number of observations by cell, an alternative would be to use Count points in polygon. This will create a new temporary layer with attributes NUMPOINTS having numbers of observations by cells.

Polygon layer : my shp file Points : my geopackage (resulting from csv)

Count points in polygon image

12
  • Thank you @simo for your help. It's not that I am interested in knowing the number of observations. It's just that I do not understand why my output has lower observations than my original file. I do not need to know the total number of observations (I am interested but it's a secondary thing) once I understand if I am doing something wrong. Do you understand my problem? I really need help on it because I am a bit lost
    – OgeiD
    Commented Dec 14, 2021 at 9:26
  • @OgeiD : got it ! But what's happening when you count observations using that technique ? do you have less or do you have the right count ? Testing it could be a way to solve / understand your issue.
    – simo
    Commented Dec 14, 2021 at 9:30
  • Thank you. I do but I am not sure how to check the total number of points. I go layer properties (information) and it appears 12.431 objects, but these are the numer of cells. And each cell has different observations. How can I count all the observations?
    – OgeiD
    Commented Dec 14, 2021 at 9:45
  • Select the resulting layer and open Attributes tables (right click), then check value of NUMPOINTS column for each cell
    – simo
    Commented Dec 14, 2021 at 9:48
  • But do I have to go cell by cell summing then or there is a way to sum the NUMPOINTS of every cell directly?
    – OgeiD
    Commented Dec 14, 2021 at 9:49
2

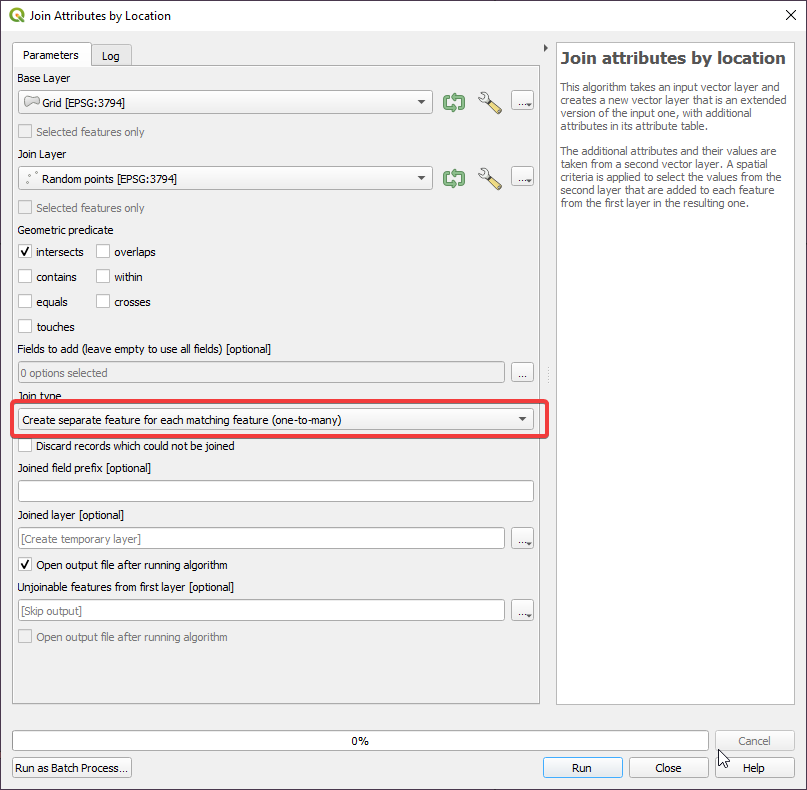
I tested and it works with Join Attributes by Location. See screenshot below. Important part is Join type and don't tick Discard records which could not be joined.

Result is a grid with information from point layer. If there are more points in one grid cell, resulting layer will contain multiple copies of that feature.

enter image description here

4
  • Thank you for your comment @Trnovstyle. I have checked and what you are suggesting it's exactly what I usually do.
    – OgeiD
    Commented Dec 14, 2021 at 10:35
  • Does it produce the result that you wanted?
    – Trnovstyle
    Commented Dec 14, 2021 at 12:01
  • It's produce the result I want but some observations are missing and I do not understand why.
    – OgeiD
    Commented Dec 14, 2021 at 14:05
  • @OgeiD So maybe you should share your data
    – Babel
    Commented Dec 14, 2021 at 14:20

Your Answer

By clicking “Post Your Answer”, you agree to our terms of service and acknowledge you have read our privacy policy.

Not the answer you're looking for? Browse other questions tagged or ask your own question.