3

I'm trying to generate a chart of NDVI bands from 2000 to 2020, but I am running into an error:

Error generating chart: Error in map(ID=19990509):
Image.reduceRegion: The default WGS84 projection is invalid for aggregations.
Specify a scale or crs & crs_transform.

How can I fix this? Here is my current code:

Map.setCenter(-75.52247, -12.73755, 13);

var onePoint = ee.Geometry.Point([-75.52247, -12.73755]);

Map.setCenter(-75.52247, -12.73755,15);

var bufferedPoint = onePoint.buffer(100);

Map.addLayer(bufferedPoint);

var collection = ee.ImageCollection("LANDSAT/LE07/C01/T1_32DAY_NDVI").select('NDVI');

var bufferedPoint = ee.Geometry.Point(-75.52247, -12.73755).buffer(100);

print(ui.Chart.image.series(collection, bufferedPoint, ee.Reducer.mean()));

Map.setCenter(-75.52247, -12.73755);

1 Answer 1

6

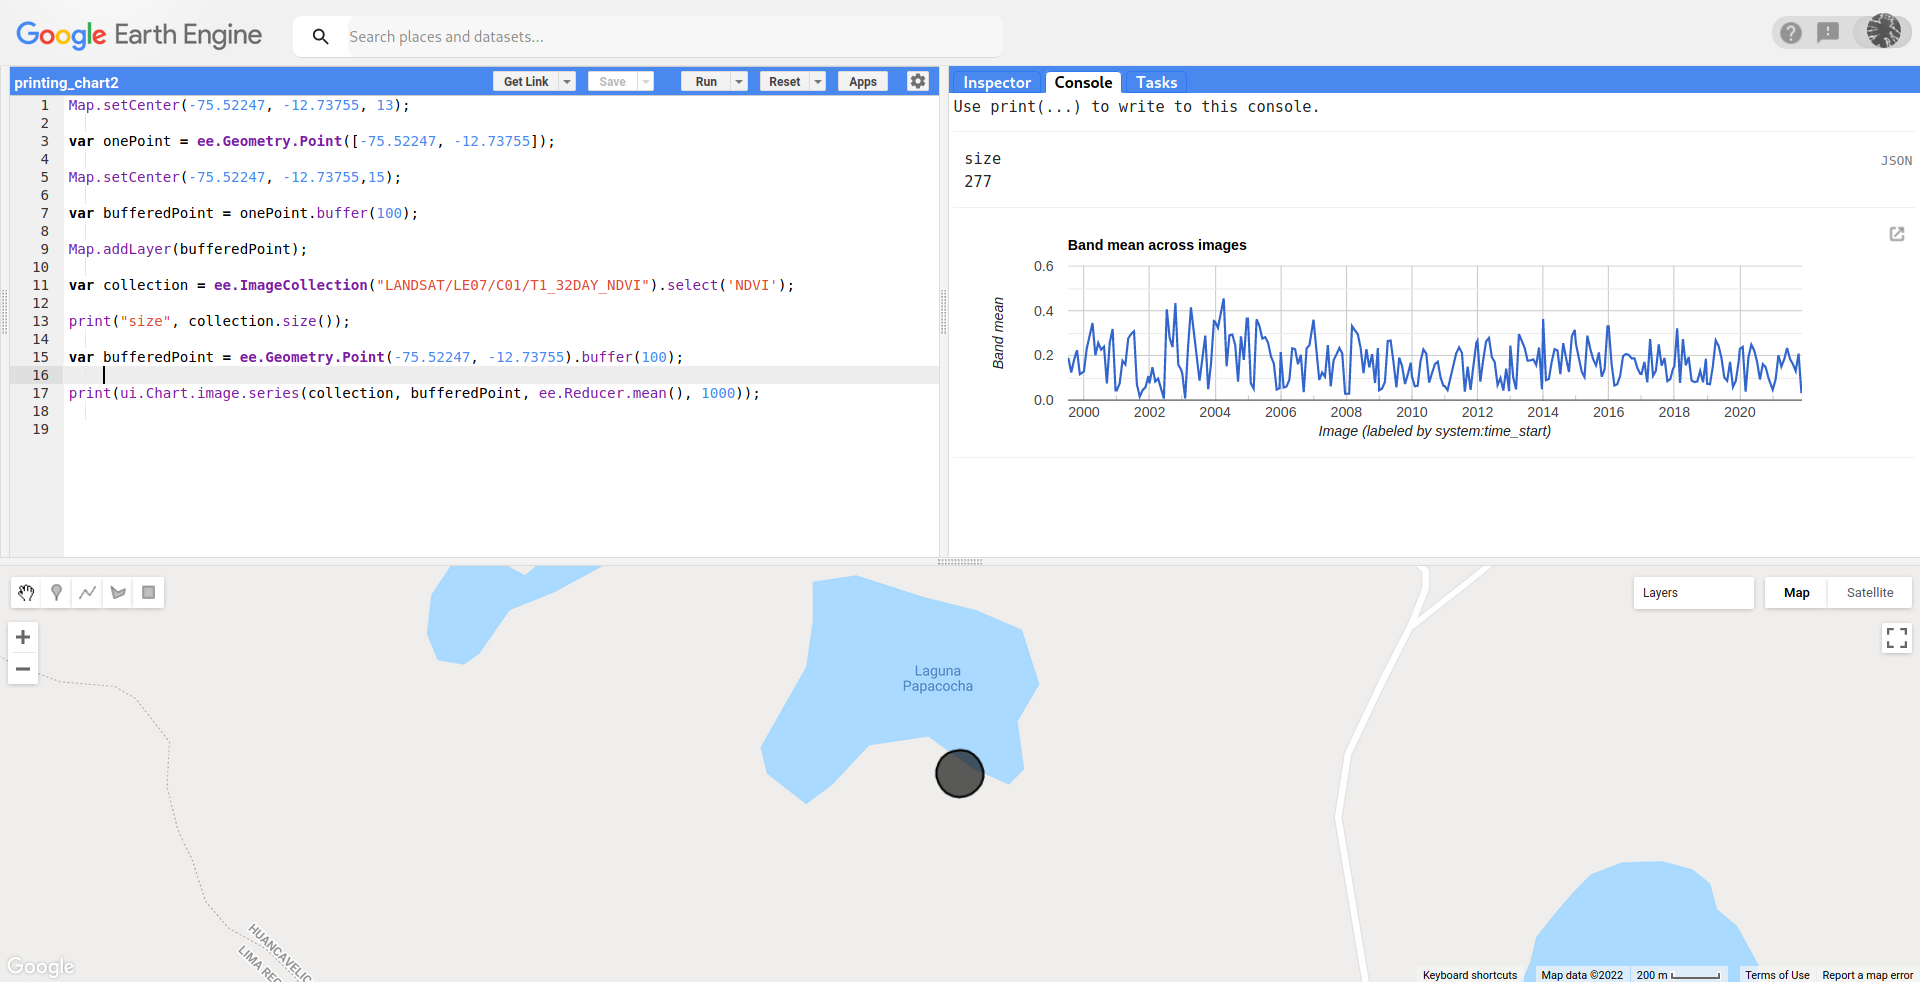
As you can see in error message, it is mandatory to specify a scale or crs & crs_transform. In my case, I arbitrarily selected 1000 as scale and, your modified code looks as follows:

Map.setCenter(-75.52247, -12.73755, 13);
    
var onePoint = ee.Geometry.Point([-75.52247, -12.73755]);
    
Map.setCenter(-75.52247, -12.73755,15);
    
var bufferedPoint = onePoint.buffer(100);
    
Map.addLayer(bufferedPoint);
    
var collection = ee.ImageCollection("LANDSAT/LE07/C01/T1_32DAY_NDVI").select('NDVI');
  
print("size", collection.size());
    
var bufferedPoint = ee.Geometry.Point(-75.52247, -12.73755).buffer(100);
    
print(ui.Chart.image.series(collection, bufferedPoint, ee.Reducer.mean(), 1000));

After running it in GEE code editor, chart is printed without any error.

enter image description here

Your Answer

By clicking “Post Your Answer”, you agree to our terms of service and acknowledge you have read our privacy policy.

Not the answer you're looking for? Browse other questions tagged or ask your own question.