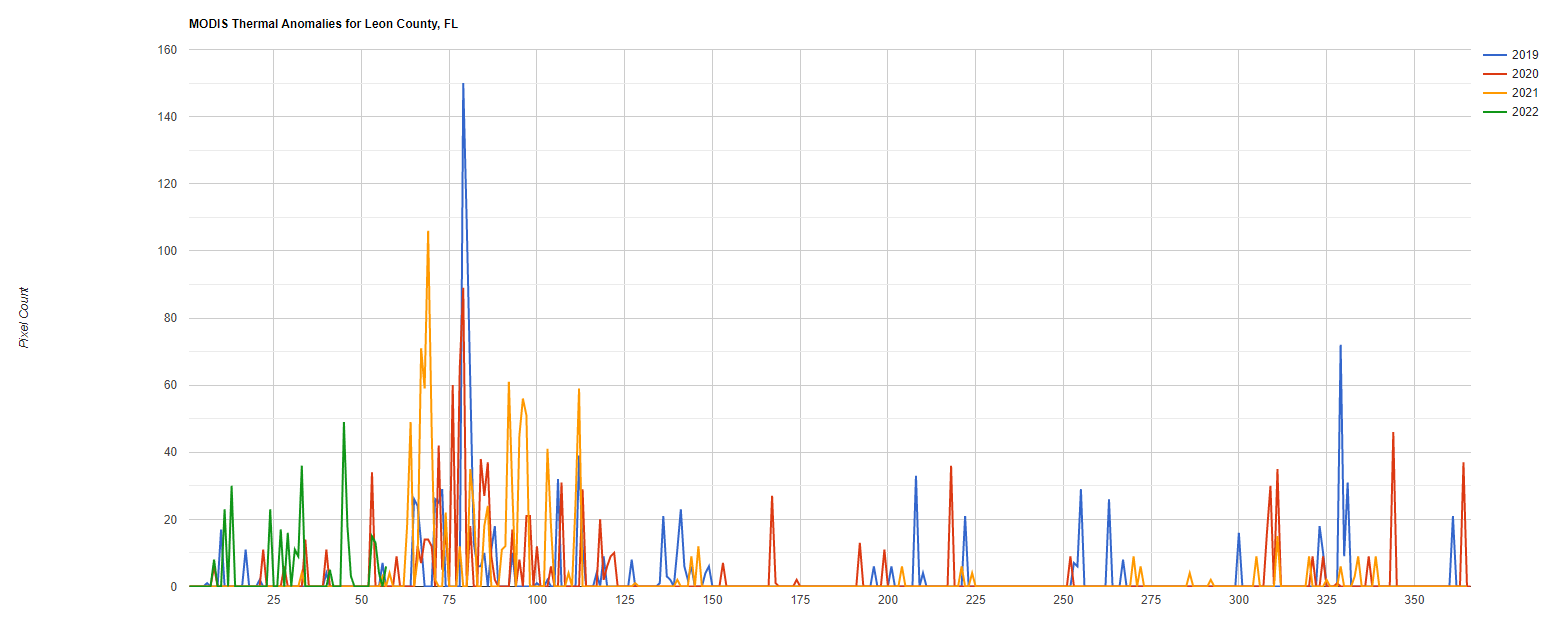
I am writing a short script that will be used to chart thermal anomalies (FIRMS) by year for a given boundary.
The following code will achieve this...
var  now = new Date()

// IMPORT MODIS ACTIVE FIRE TIME SERIES
var FIRMS = ee.ImageCollection('FIRMS')
  .select('T21').filterDate('2019-01-01',now)

// ISOLATE AREA OF INTEREST
var Leon = SE_Counties.filterMetadata('NAME','equals','Leon')
print(Leon)

// TIME SERIES CHART
var options = {
    title: 'MODIS Thermal Anomalies for Leon County, FL',
    fontSize: 12,
    hAxis: {},
    vAxis: {title: 'Pixel Count', viewWindow: {min: 0}},
    //legend: {position: 'none'},
};

var chart = ui.Chart.image.doySeriesByYear(FIRMS, 'T21', Leon, ee.Reducer.count(), 1000).setOptions(options);
print(chart)
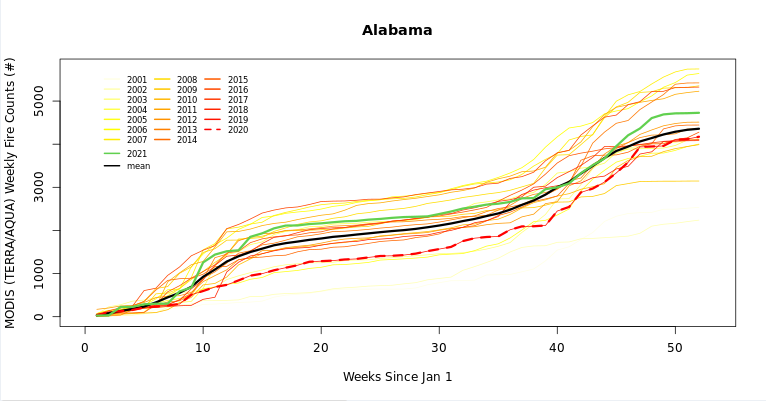
 However I am also interested in plotting thermal anomalies cumulatively like this..
I checked out this example (Iterating over an ImageCollection) but I couldn't figure out how to customize the code to work with my data.
What would be a solution for this?
